Accurately Predicting Ad Blocker Savings
This research was conducted by Dr. Andrius Aucinas, performance researcher at Brave, Moritz Haller, data scientist at Brave, and Dr. Ben Livshits, Brave’s Chief Scientist.
We have written before on Brave’s performance, energy and bandwidth benefits for the user. Brave Shields is our primary mechanism for protecting user privacy, but many users know by now that ad and tracker blocking (or just ad blocking for short) makes the web faster and generally better for them. So far Brave’s estimates of the users’ time saved have been very conservative and somewhat naive: we take the total number of ads and trackers blocked, and multiply that by 50 milliseconds. Why this specific number? It is at the low end of what others have estimated to be third-party JavaScript execution overheads, but in fact both in the third-party impact study and in our measurements in this study, the average and median impact of an ad or tracker is more than 10 times higher. Clearly, it is time for an update.

However, we can’t typically know without loading the full, bloated version of a page, just how much of the user’s resources are saved. The way current ad networks work makes the problem even more challenging: typically a script included directly by a publisher is only the tip of the iceberg that sets off a chain of requests to many third parties. Let’s take The Verge as a concrete example: the two graphs illustrate loading the main page with ad blocking (top) and without (bottom), where the little colored lines in the illustration show when each network request happened and how long it took, and the summary bar at the bottom of each graph provides top level statistics: how many requests were made, bandwidth used, and a few load time metrics.


What is evident from this illustration is that the savings are substantial: multiple megabytes and seconds of loading time for a single page. Brave prevents most of the requests from even being made: out of the 48 requests, 12 are blocked, implying neither network traffic nor processing load, while the other 364 (!) requests made over the course of a minute while on the page are never even seen. Not shown in the developer tools: the blocked resources that would have contributed 2.8 seconds of CPU time for just executing JavaScript, on a single page.
So we set out to explore how we can accurately predict how much exactly we save from a clean page - one that has had all ads and trackers removed. It turns out we can accurately estimate bandwidth and compute time savings based on page details like the few blocked resources we observe, as well as the clean page’s performance metrics, number of the different types of resources loaded and the overall page DOM size.
Important Performance Metrics
Another detail that the earlier figure helps illustrate is the difficulty of choosing the “right” performance metrics. The ones in the figure, DOMContentLoaded and Load (Page Load Time) are some of the most generic metrics that are widely used. However, the web performance community has largely rejected them by now and it isn’t hard to see why: a lot of network events happen well after the page is “loaded”, especially with no ad blocking where the last network events recorded still happen after a full minute from starting the page load, while the page was “loaded” after 1.4 seconds! At the same time, there are various arguments that they don’t correctly reflect the actual user experience and alternatives such as First Meaningful Paint (the time when the important visible parts of the document have been painted and the user can start consuming the content) have been proposed, but they are hard to generalize across a wide set of different pages.
There are, however, two metrics that are universal across websites and reflect the amount of resources consumed by a page:
- Total bandwidth used, including all resources loaded by the page, synchronous, asynchronous, content, ads, etc.
- Total JavaScript CPU time used, measuring the cumulative time taken by scripts running on the main thread. Since JavaScript is essentially single-threaded (except if Web Workers are used), this accounts for all script execution time.
These metrics do not try to answer how fast a website feels for the user, but they reflect other performance aspects, like how responsive the device is during browsing, how much energy it consumes, how much of the user metered data plan is used. Remember that not everyone is browsing the web with the top-of-the-line device on a 5G network with an “unlimited” data plan.
Among the many benefits of ad and tracker blocking, it improves both of these metrics. Let’s define the bandwidth savings and CPU time savings as the difference between bandwidth and CPU time used with and without ad blocking. Our goal is then to model how much ad blocking saves by only observing the page when loaded with ad blocking on.
Test Setup
We start by collecting data across a relatively small but diverse set of websites. We selected 100 sites and 10 pages on each site:
- 30 popular publishers and ecommerce sites (including BBC, CNN, The Washington Post, Amazon UK, Ebay UK)
- 40 random sites among Alexa Top 400 sites in the UK, skipping duplicates from the first set as well as adult content pages. This included web sites of ISPs, train ticketing, ecommerce, news outlets, etc.
- 30 random sites among Alexa top 400 - 10000 sites in the UK, making sure that the pages are actually working. This further widened our page diversity to include pages in other languages, e.g. Russian, Dutch and Norwegian, although most of the pages were still in English.
For each site, 10 random pages linked from the main page were selected to further diversify the pages in our dataset. The complete lists of sites and pages are included in the GitHub repository along with the code we used for data collection.

To collect the data, we extended the Lighthouse tool for automated auditing of web page performance. In addition to the various default metrics that Lighthouse tracks out of the box, we added “User tracking metrics” based on our Ad Blocker:
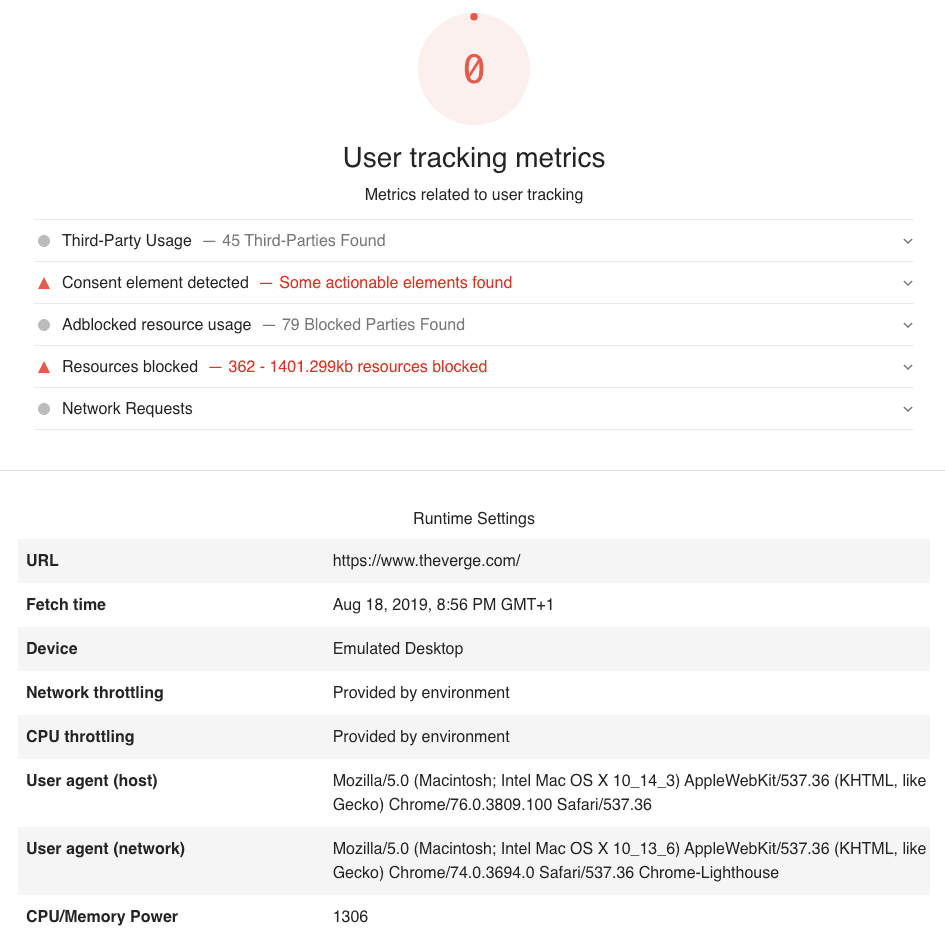
- For Resources Blocked we process all network resources recorded by the test run and run Ad Blocker as a Node module with Brave’s default adblock lists. The screenshot above illustrates a run (The Verge) with ad blocking disabled which finds 141 requests that would have been blocked, with a total size of 1.2MB.
- For Third-Party Usage we include LightHouse standard audit that maps from individual request URLs to a smaller number of organisations that control those addresses
- For Adblocked resource usage we use the same mechanism of identifying third-parties, but only apply that to blocked requests and also include first-party requests as those are sometimes also blocked.
- Finally, Consent element detected indicates that we found cookie (or tracking, GDPR) consent request element on the page and automatically accepted it before collecting the data. This is important for pages that actually respect user consent, for example previously mentioned The Verge does not install trackers and load ads until the user consents.
Each page was measured in two passes: the first pass to accept any cookie/tracking consent, emulating a real user, and the second pass actually collecting the page metrics. For this experiment, we loaded the pages with network cache disabled, which yields more predictable results between separate test runs, but increases the overall bandwidth consumption. Nevertheless, trackers and ads would not be cached often, as ad networks do matching and select relevant ads to show on every page visit. We plan, however, to analyse caching behaviour of web trackers as well as caching of their content in the future for even more accurate predictions.
This was repeated separately with ad and tracker blocking disabled/enabled, one page at a time. Finally, to reflect different device capabilities, we repeated the experiments in 2 environments, mainly differing by CPU and memory available, but same operating system and browser version (Brave Nightly Version 0.71.69, with Chromium 76.0.3809.132). In both cases the browser was instrumented to use the same window and viewport size. The two machines were:
- 2018 MacBook Pro 15” with 32GB RAM, 2.6 GHz Intel Core i7
- Early 2015 MacBook Pro 13” with 16GB RAM, 2.9GHz Intel Core i5
In all environments we used the same fast residential WiFi network, additionally throttled in the emulated mobile device setup. Data collection for the almost 1,000 URLs ran over 3 days, so there could be some content differences in the pages between subsequent loads, however a sufficiently robust model should be able to address that. In total, we collected 1686 good page load samples (out of the 1000 URLs on each environment) after discarding measurements where the main document didn’t load at all and set aside 20% of the samples for model validation.
Building a Performance Predictor

The above figure illustrates the bandwidth and CPU time savings as described earlier. In our dataset, the average bandwidth savings from ad blocking is 899KB, however it is heavily skewed towards the very heavy pages. The median is just under 500KB while the 95-percentile is triple at 2,760KB! Similarly, JavaScript CPU time averages around 2.6 seconds for the blocked resources, with median at 0.5s and 95-percentile at a whopping 13.5 seconds. Since both form a long-tail distribution, just taking the average or median values wouldn’t tell us very much.
To predict the savings of ad blocking, we build a machine learning model using a number of features extracted by our modified instance of LightHouse. The features we use for prediction fall broadly in these categories:
- Requests during a page load that were blocked
- Recorded performance metrics
- Count and sizes of the different types of request (images, scripts, etc)
- DOM features (number of nodes, maximum number of child nodes for any node)
- JavaScript task statistics
- Presence of specific third-parties, “one-hot” encoded (presence of a feature is encoded to number 1, absence - 0, and each third-party is treated as a separate feature)
Features that correlate most closely with the results naturally can be best used to predict the ad blocking savings. So for a better intuition of what the features are like, we take a look at how they correlate with each of our target variables
| Bandwidth Savings | CPU Time Savings | ||
| Feature | Correlation | Feature | Correlation |
| Adblock Requests | 0.450025 | Adblock Requests | 0.289491 |
| “Document” request count | 0.317931 | Critical request chain duration | 0.202306 |
| DOM maximum child elements | 0.200295 | Load Time | 0.179111 |
| JS Tasks | 0.174220 | “Font” request count | 0.144993 |
| Bootup time | 0.153897 | “Document” request count | 0.139712 |
| Third-Party request count | 0.148594 | Last Visual Change | 0.123597 |
| Total JS Task Time | 0.128352 | JS Tasks Over 10ms | 0.118535 |
| First Meaningful Paint | 0.110667 | JS Tasks Over 25ms | 0.115637 |
| First Visual Change | 0.096120 | JS Tasks Over 50ms | 0.112370 |
| “Other” request count | 0.091173 | Total JS Task Time | 0.109052 |
No big surprises here – the closest correlated feature in both cases is the number of blocked requests we observed, and others include counts of various requests made, page complexity, and amount of JavaScript work executed. JavaScript is generally used to handle the more complex aspects of web page logic - image carousels, interactive graphics, lazily loaded images, etc. Curiously, JavaScript execution has some correlation with bandwidth savings, suggesting that more complex pages (or ones less optimised to work well for users) also include more trackers and ads to be blocked.
For the correlation computation we exclude the one-hot encoded features indicating the presence of specific third parties, however those features also have high importance scores. Some of the top features by importance for bandwidth savings are:
And while one of them is a CDN that can host anything, all others are players in the ad ecosystem. Amazingly enough, there are pages in our dataset where every one of the third-parties above is included on a single page.
For the prediction task itself, we settled on the LASSO method after some standard model exploration. It is a linear model that tends to prefer solutions with fewer non-zero coefficients, effectively reducing the number of features upon which the given solution is dependent and it works well in practice for our task. Using it separately for bandwidth and CPU time savings, we fit the model on the logarithm of the target values due to the shape of their respective distributions. We did explore the options for feature selection to limit the number of features, however all 237 features (191 of them categorical, encoding presence of specific third-parties) turned out to have an effect on prediction quality in our dataset.
In our dataset, this relatively simple model predicts bandwidth savings of unseen data samples (20% of the dataset) with R² = 0.68. For a more visual illustration of the quality of the fit, we can use the simple average bandwidth saving as the alternative “model”. The figure below shows the error from the two models: orange dots are the errors of the model for each page, while blue dots are the differences between the average and actual savings for each page (the pairs of dots are ordered by the model error). Note that the fit is illustrated in logarithmic scale, so the distance between the orange dots (prediction) and the blue dots (difference from the average savings) easily mean hundreds of kilobytes to megabytes of difference for each page load. Furthermore, bandwidth savings due to ad blocking are inherently noisy because each ad served can have different sizes and they change from one page visit to another. Given the noisy data, simple model, and a relatively small dataset, the results are very encouraging.

JavaScript execution time turns out to be a lot harder to predict. Reasons for this are many: difficulty of attribution to blocked scripts when loading with ad blocking disabled, differences in device performance even between the two machines we used and finer granularity of measurements than bandwidth without necessarily higher accuracy. The prediction quality is still much better than taking the naive average figure (remember that the distribution is heavily skewed, so it is bound to be a poor estimate), however the outliers affect the results a lot more. While the R² metric on unseen test data in this case is still good at 0.73, we see significantly higher mispredictions by our model at both extremes.

The predictor runs over time as users browse the web, so it matters how the errors accumulate over time. To evaluate this without making assumptions about a specific “strawman user”, we take random samples of our test-set pages as emulated browsing histories, also allowing for repetitions of the same page, and total up the prediction error over each such simulated navigation. We generate 100 such random browsing sessions, with 10 pages visited each, and another set with 30 pages visited in each session. The graph above illustrates the results: the solid lines show our model’s error for each of the 100 sessions, separately for 10- and 30-page long sessions. Compare them to the dashed lines that demonstrate error accumulation with simple mean as the predictor. While our model tends to under-estimate the savings, the median error over 30 page sessions is 2.7MB, while the median error for the corresponding mean predictor is 12.2MB.

The graph above illustrates the misprediction errors on a linear scale, in seconds: we see that for most of the points the error is very small, but at both ends of the spectrum it grows into tens of seconds. At the same time, the inaccurate predictions correlate with rather unusual page behaviour as well: 30-40 seconds of CPU time of a fairly powerful device should certainly not be the norm. In fact, we checked some of the outlier pages to find that they do indeed load dozens of trackers and heavy ads, sometimes with videos, across a number of different ad networks.

Using the same method as we did for aggregating bandwidth saving prediction errors, we also look at how CPU time prediction errors accumulate. Once again, our model’s error accumulates much more slowly (the distance between the solid-color lines) than that of the simple mean (dashed lines) with the browsing session getting longer. In fact, the median error of our model is just 8.7 seconds, compared to 58.2 seconds of the simple mean over the 100 simulated sessions of 30 pages each.
Conclusions
We explored the possibility of predicting ad and tracker blocking savings for web performance based on just the features of a clean page (with all ads and trackers blocked). We collected a set of almost 1,000 pages with widely varying levels of ads and trackers embedded - from almost nothing on sites like apple.com to online publishers with a dozen different ad networks connected on a single page and hundreds of requests loaded. We found that we can build a reasonably accurate resource use prediction model from this relatively small dataset.
We looked at slightly unusual metrics for page resource use: bandwidth savings and JavaScript CPU time savings. Despite their imperfections, both provide a more accurate picture of the resource cost of viewing a page than e.g. “Page Load Time”, because they include ongoing resource usage after the initial view has loaded, and ultimately are key factors to the overall user experience: how good a network connection or how powerful a device they need for adequate browsing experience, or how much of the battery will be burned up for ads.
Having trained a fairly simple regression model we found that features of a page loaded with ad and tracker blocking turned on can be used as an accurate predictor of bandwidth savings. This includes both the third-parties discovered and blocked, as well as page performance metrics and JavaScript execution task. Overall bandwidth savings could be accurately predicted with R² metric measuring the quality of the fit at 0.68. JavaScript execution time is, unsurprisingly, a lot harder to predict and our model despite achieving a good R² score of 0.73, struggles to deal with the more extreme examples. While we should be able to extend the model to fit those cases as well, the abuse of the users’ devices is quite staggering in those cases and should be fixed by the content publishers and advertising networks.
It is very likely that we would be able to predict bandwidth savings even better and improve on the CPU time prediction with a bigger dataset and a more complex model. Model complexity alone, however, is very likely to lead to overfitting to the data that we have instead of generalizing to all pages. Nevertheless, ads and trackers tend to vary a lot and our models already show a huge improvement over the conventional wisdom of average costs.


