
Brave for Desktop Outperforms Other Browsers in Speed and Performance
This post is part of an ongoing series evaluating Brave’s performance. It describes work done by Soumyajit Chatterjee (Systems and Performance Researcher), Kleomenis Katevas (Principal Machine Learning Researcher), Artem Chaikin (Staff Security Engineer), Pete Snyder (Principal Privacy Researcher), and Hamed Haddadi (Chief Scientist, Visiting Professor).
We recently ran new benchmarks comparing Brave against the three most widely used desktop browsers: Chrome, Edge, and Firefox. We found that Brave for desktop is faster, uses less energy, consumes less CPU and memory, and transfers less data. Specifically, across all tested browsers Brave:
- Uses on average 44% less CPU
- Uses on average 10% less energy
- Uses on average 28% less memory
- Loads pages 20% faster
- Transfers 26% less inbound data
- Transfers 39% less outbound data
These results closely resemble our 2025 tests showing that Brave for Android outperforms other mobile browsers in page-load speed, battery consumption, CPU usage, and network use. As with Android benchmarks, we attribute our wins on the desktop benchmarks to Brave’s built-in privacy and security features, namely its adblocking and tracker blocking. These eliminate unnecessary network requests and reduce processing overhead during browsing.
Testing environment: hardware and software
This desktop testing was conducted on an Apple Mac Mini with an Apple M2 chip and 8 GB of unified memory, running macOS 26.5.1 (25F80).
The following browser versions, which were the latest available at the time of testing, were used:
| Browser | Version |
|---|---|
| Brave | 1.92.139 (Chromium 150.0.7871.114, arm64) |
| Chrome | 150.0.7871.184 (arm64) |
| Edge | 150.0.4078.83 (arm64) |
| Firefox (Playwright Gecko) | 146.0.1 (64-bit) |
All tests were conducted on a dedicated 50Mbps internet connection in London, UK.
Methodology
Workload
We tested the 50 most popular websites as ranked by Brave Search statistics, loading each landing page. Each experiment was repeated 10 times, with the order of browsers randomized across runs. This counterbalances order effects so that no single browser systematically benefits or suffers from its position in the sequence.
For each browser, we created a clean baseline user data directory with default settings. Before every test run, we copied this baseline into a fresh, isolated temporary directory, ensuring that no cached data, cookies, or persistent state from previous runs influenced the results. We then launched the browser against this isolated profile and waited 60 seconds for background processes to stabilize before beginning measurements.
Desktop benchmarking
To evaluate browser performance on macOS, we used a locally-hosted Apple Mac Mini. Brave’s browser automation was handled using a tool developed using the Playwright framework (v1.58.2), which provides a cross-browser API for automating and instrumenting a wide range of browser behaviors in a consistent and reproducible way. These behaviors include network requests, page lifecycle events, and worker script activity.
For each browser configuration, a clean browser profile was prepared, followed by a 60-second stabilization period. The browser then visited each URL in the measurement list. Each loaded page remained open for 30 seconds before the browser window was closed, after which the next URL was loaded.
For page loading time, we measured the time from navigation start to the loadEventEnd event, using injected JavaScript via Playwright instrumentation.
Energy consumption on macOS was estimated by integrating instantaneous system power obtained from powermetrics at a 350ms sampling interval. Results are reported in milliwatt-hours (mWh).
CPU utilization was measured using process-level statistics from ps, aggregated across all browser-related processes (main, renderer, GPU, utility, etc.) to capture total CPU load attributable to the browser. Memory was measured as the resident set size (RSS) aggregated across browser processes, also via ps. Network usage was measured using Playwright’s page-scoped instrumentation, which records requests and responses attributable specifically to each loaded page (allowing us to accurately isolate per-page network activity from background browser processes), and compute aggregated transmitted/received bytes including headers and payloads.
Metrics and points of comparison
Our performance evaluation focuses on the following attributes:
- Energy consumption: Total energy required to load and render each webpage (mWh)
- CPU utilization: Processor load during page loading and rendering
- Memory usage: Memory footprint associated with each page execution
- Page load speed: Time from navigation start to
loadEventEndand the LCP render time - Network data consumed: Total inbound data (response) and outbound data (request) per browsing session
Resource usage
Energy
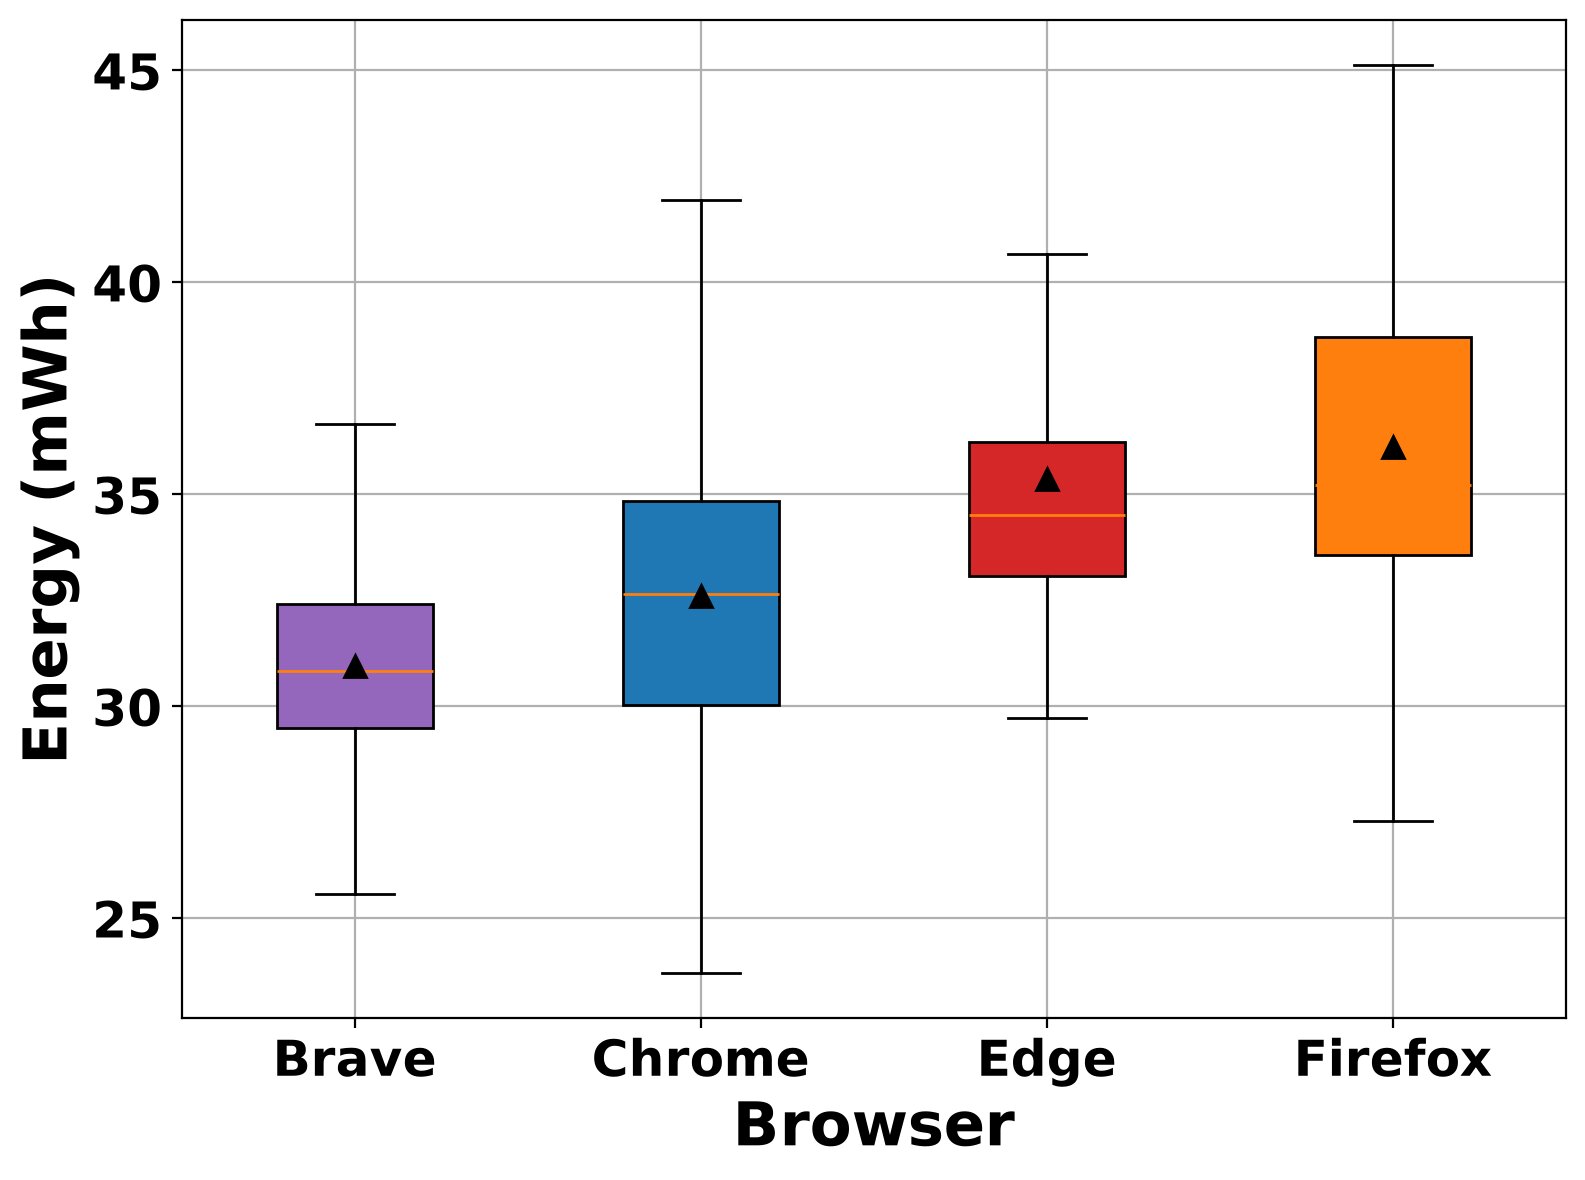
Figure 1 shows the distribution of energy consumption (mWh) per page load across the four browsers. Brave is the most energy-efficient browser tested, with an average consumption of approximately 31.1 mWh. This is 4% lower than Chrome’s average (~32.5 mWh), 12% lower than Edge’s average (~35.3 mWh), and 14% lower than Firefox’s average (~36.1 mWh). Additionally, Brave exhibits a notably tighter distribution (smaller interquartile range and shorter whiskers) compared to the others, indicating more consistent energy behavior across different websites and less variability in power draw during page loads.
The gap between Brave and two of the other baseline browsers (Edge and Firefox), is particularly striking. Both consume meaningfully more energy per page load on average, with Firefox showing the widest spread in its distribution. Such a wide spread suggests higher variability in how efficiently the browser can process different page types.
CPU
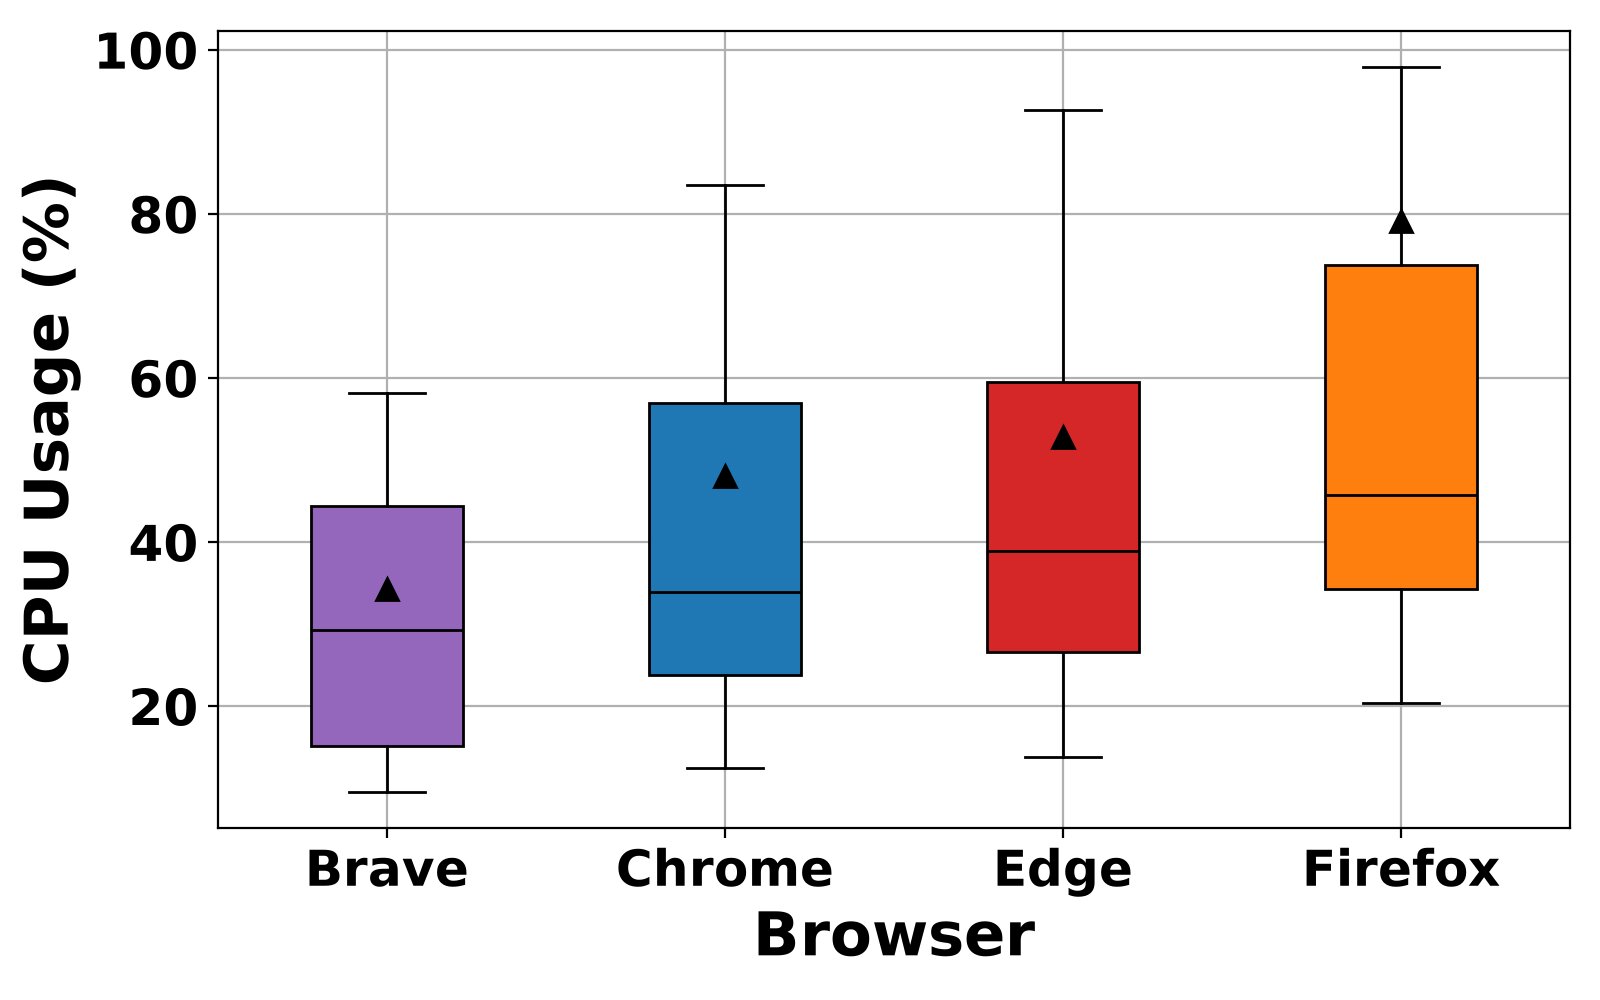
The CPU utilization results, shown in Figure 2, tell an even more pronounced story. Brave records a mean CPU utilization of approximately 33%. This is significantly lower than Chrome’s mean (~47%), Edge’s mean (~53%), and Firefox’s mean (~78%).
Firefox’s CPU usage stands out in particular. Its mean is nearly two-and-a-half times greater than Brave’s, and in the worst observed cases it approaches 100% utilization—suggesting that for some pages, Firefox saturates one or more CPU cores entirely during loading and rendering. This is consistent with Firefox’s distinct Gecko engine architecture, which handles certain page workloads differently from the Chromium-based browsers. Brave, Chrome, and Edge all share the Chromium engine, yet Brave’s native adblocking removes a substantial portion of the page resources that would otherwise need to be fetched, parsed, and executed. Together, this filtering directly reduces the CPU work required per page load.
Memory
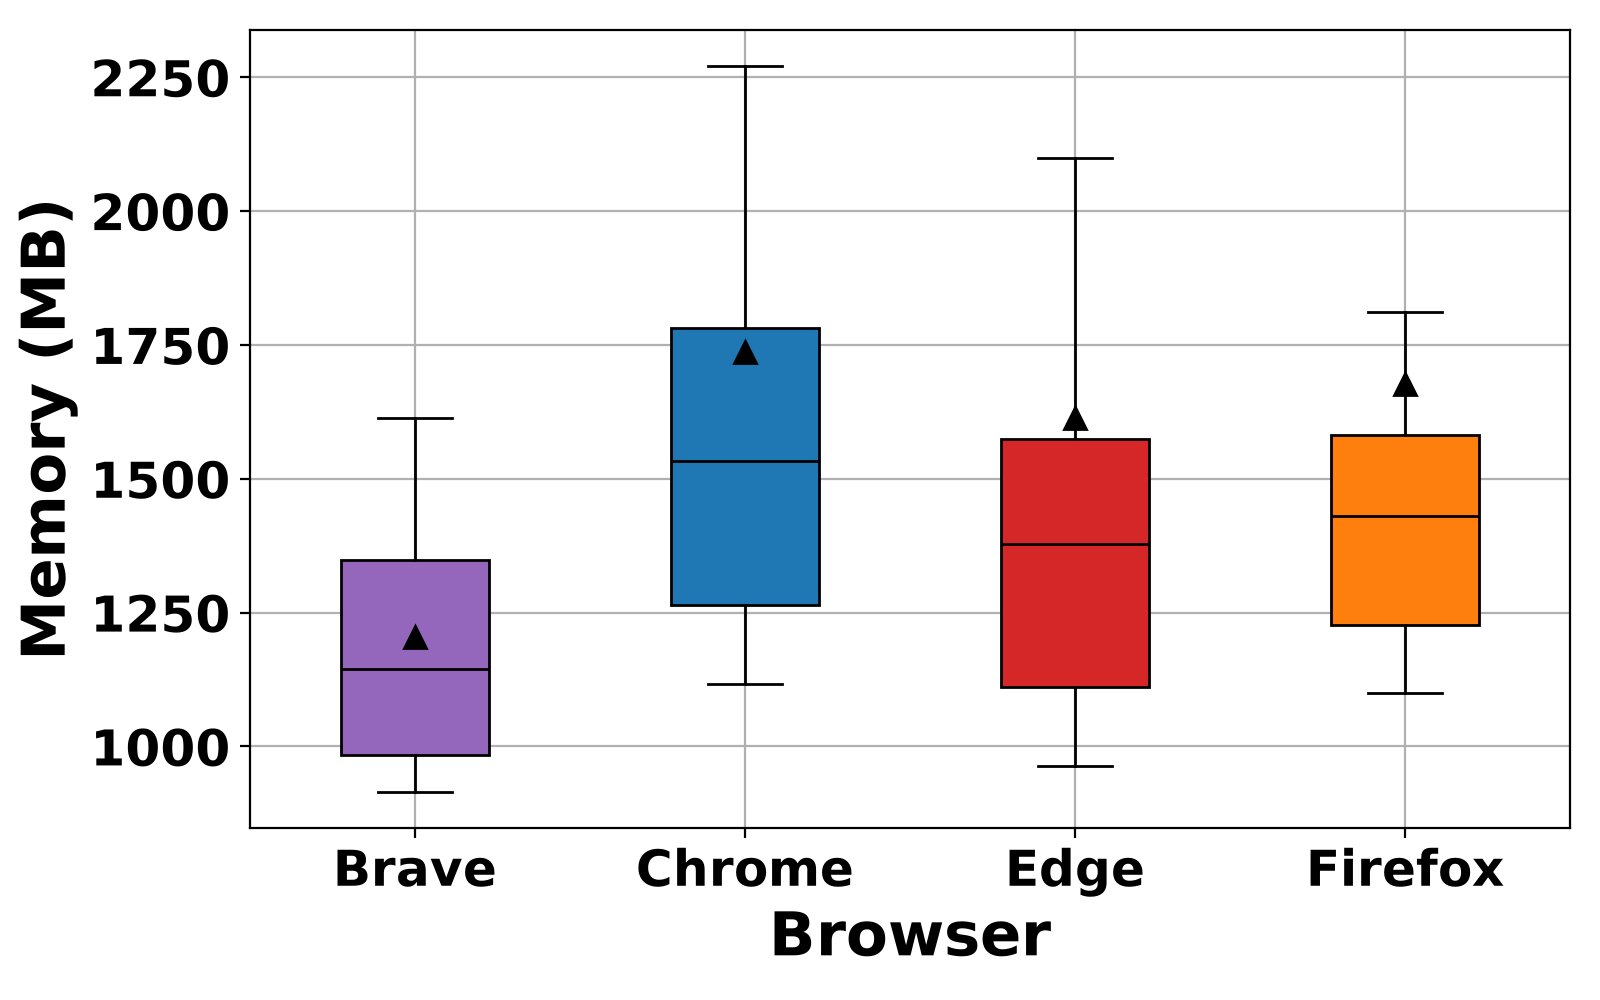
Figure 3 presents the memory consumption (resident set size—or RSS—in MB) per page load. Brave is the most memory-efficient browser tested, with a mean of approximately 1,200 MB. This is 31% lower than Chrome’s average (~1,750 MB), 26% lower than Edge’s average (~1,620 MB), and 27% lower than Firefox’s average (~1,650 MB).
This efficiency is a direct result of Brave’s architecture, which manages process isolation and caching differently than its competitors. While other browsers often retain more background state or rely on less optimized memory management for their default configurations, Brave’s native adblocking and tracker blocking reduces the number of resources that need to be held in memory simultaneously. Brave is actively working on further reducing memory overhead in its native blocker, so we expect this advantage to be maintained or extended in future versions.
Page load speed
Load event end time
Figure 4 shows the distribution of page load times, measured from navigation start to the loadEventEnd event. Brave achieves a mean load time of approximately 4.4 seconds, compared to an average of 5.1 seconds for Chrome (16% higher than Brave), 5.3 seconds for Firefox (20% higher), and 6.0 seconds for Edge (36% higher).
Edge shows the widest interquartile range and the highest median of the four browsers, suggesting it is both slower on average and less consistent across different sites. The load time advantage for Brave is consistent with its adblocking, which eliminates a substantial number of the third-party requests (ads, trackers, and analytics scripts) that other browsers must fetch, parse, and execute before the load event can complete.
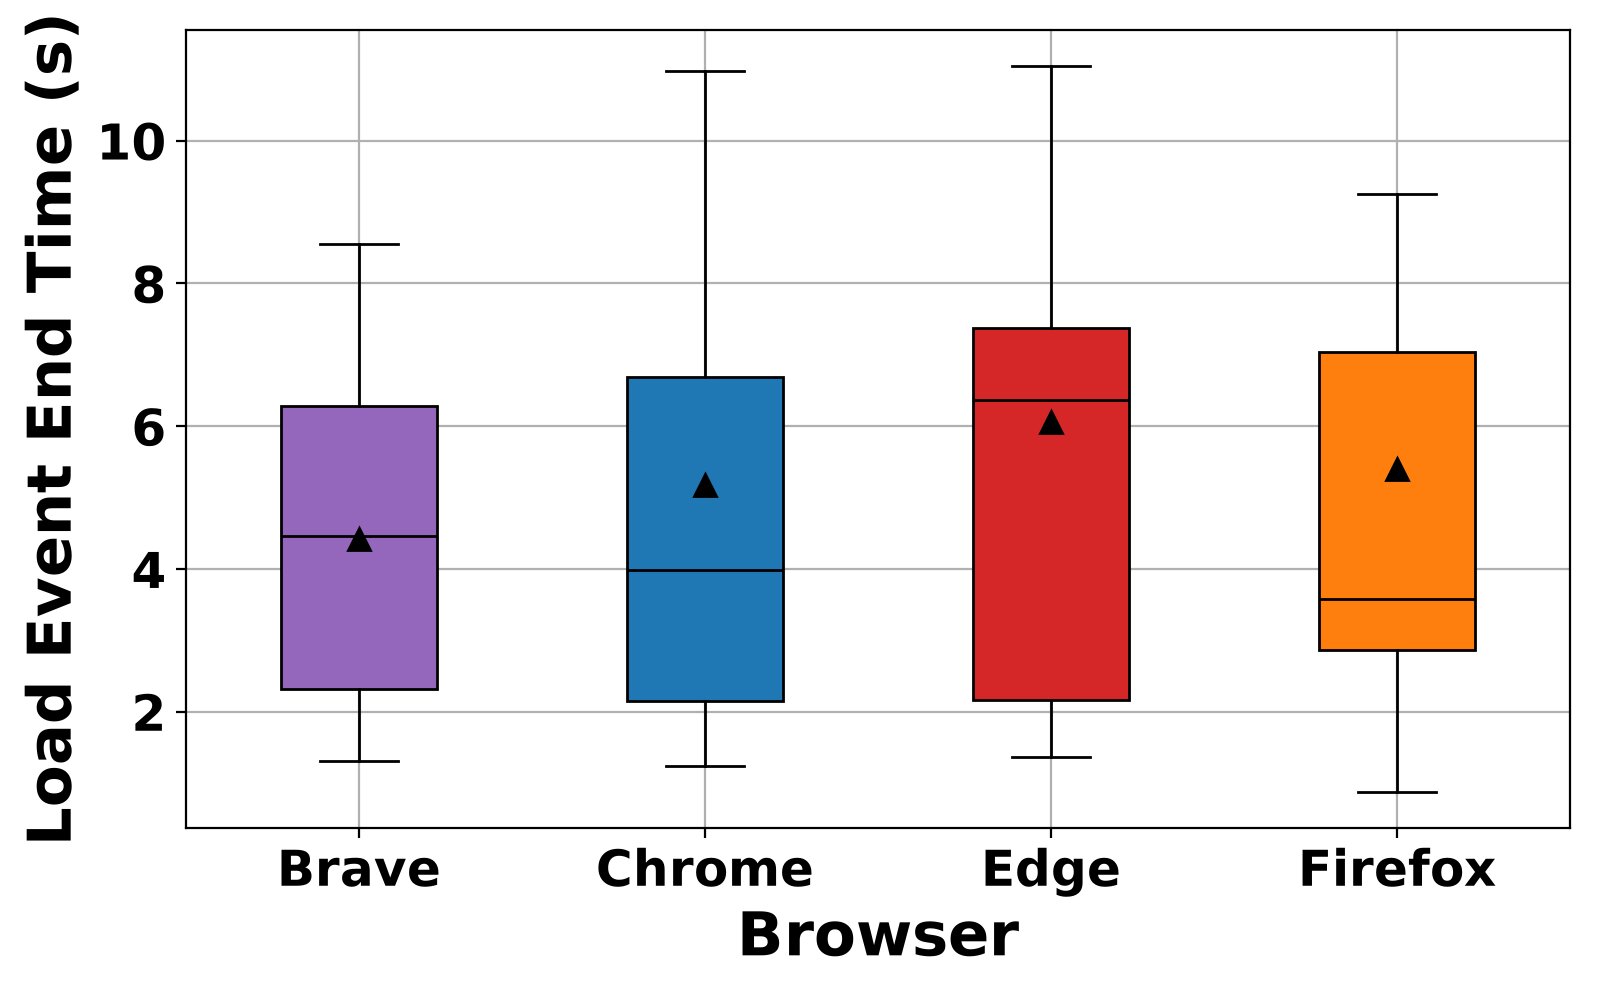
loadEventEnd, across the four tested desktop browsers. Triangles represent the mean; horizontal lines represent the median. Lower scores are better.
LCP render time
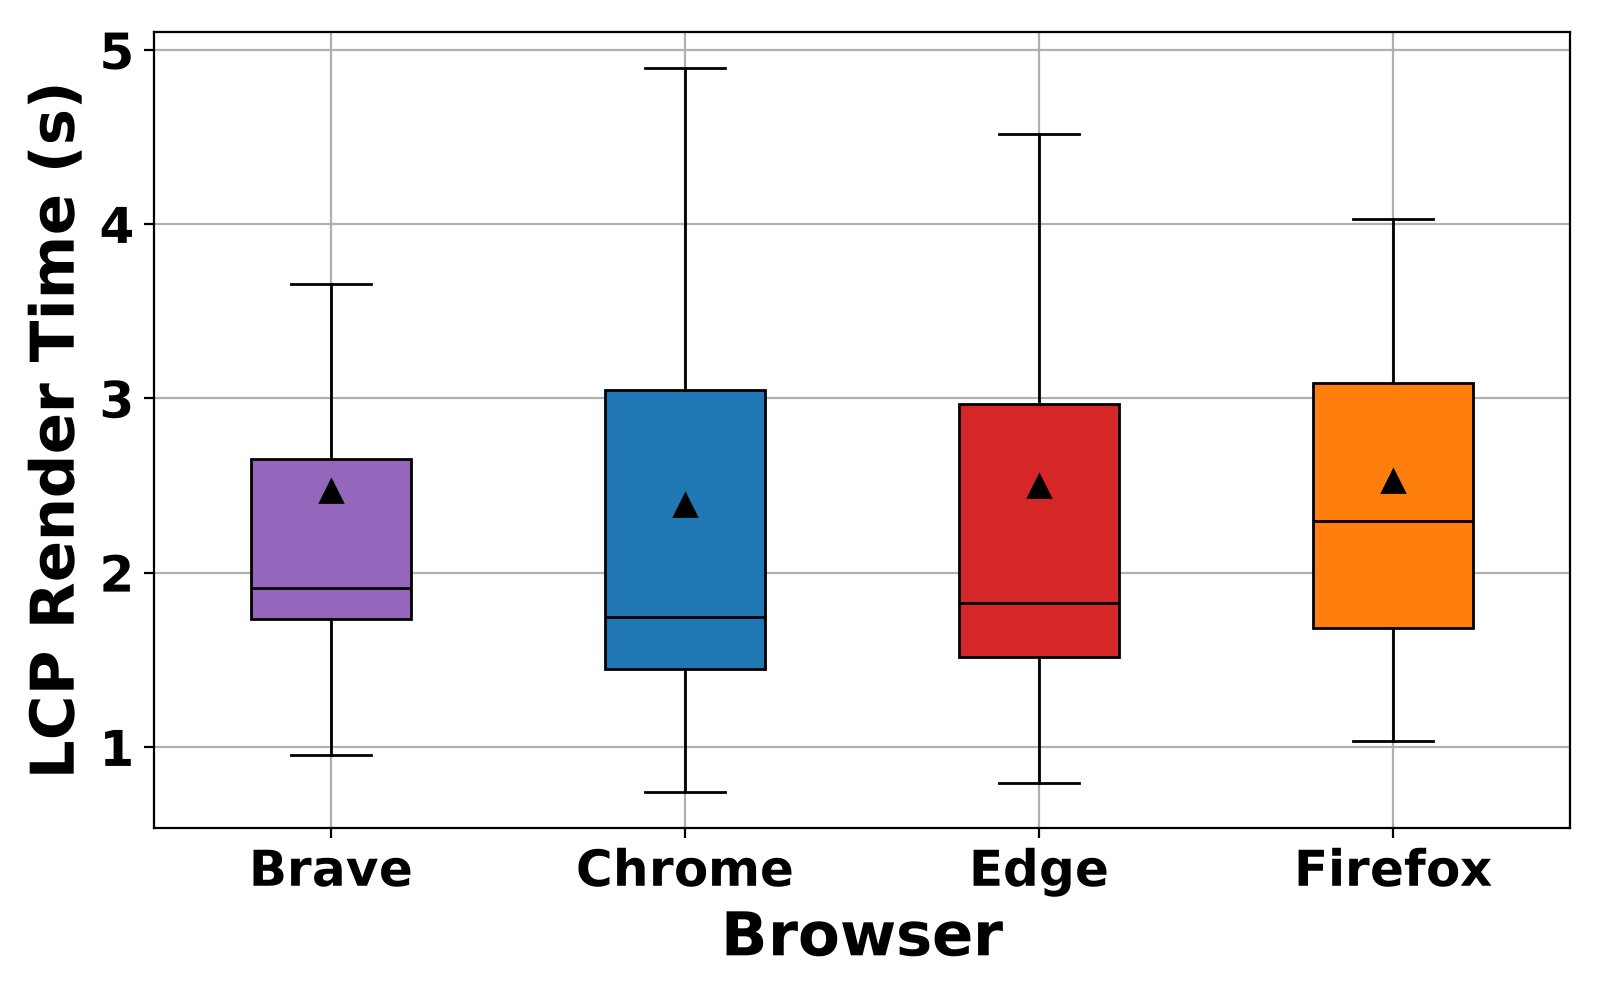
Figure 5 presents Largest Contentful Paint (LCP) render times—a user-visible measure of when the main visual content becomes available. The four browsers cluster more tightly on this metric than on resource usage or load completion. Brave achieves a mean LCP of approximately 2.4 seconds, statistically indistinguishable from Chrome at the same value. Edge and Firefox trail slightly at ~2.5 seconds each.
This convergence in LCP is worth unpacking. While Brave completes the full page load significantly faster than its competitors (as shown above), the time to render the largest visible element is broadly similar across all four browsers. This suggests that the bulk of Brave’s load time advantage comes from eliminating resources that load after the primary visual content is already rendered (resources such as background trackers, analytics calls, and deferred scripts) rather than from speeding up the critical rendering path itself. For users, this means the page appears ready at roughly the same time across browsers, but Brave finishes all background work faster and with less CPU and energy expenditure.
Network data consumed
To evaluate network efficiency, we analyzed two metrics: response size (inbound data received, analogous to network Rx) and request size (outbound data transmitted, analogous to network Tx). These were captured using Playwright instrumentation, recording aggregate bytes across all browser-level requests and responses per page load.
Response size (inbound data)
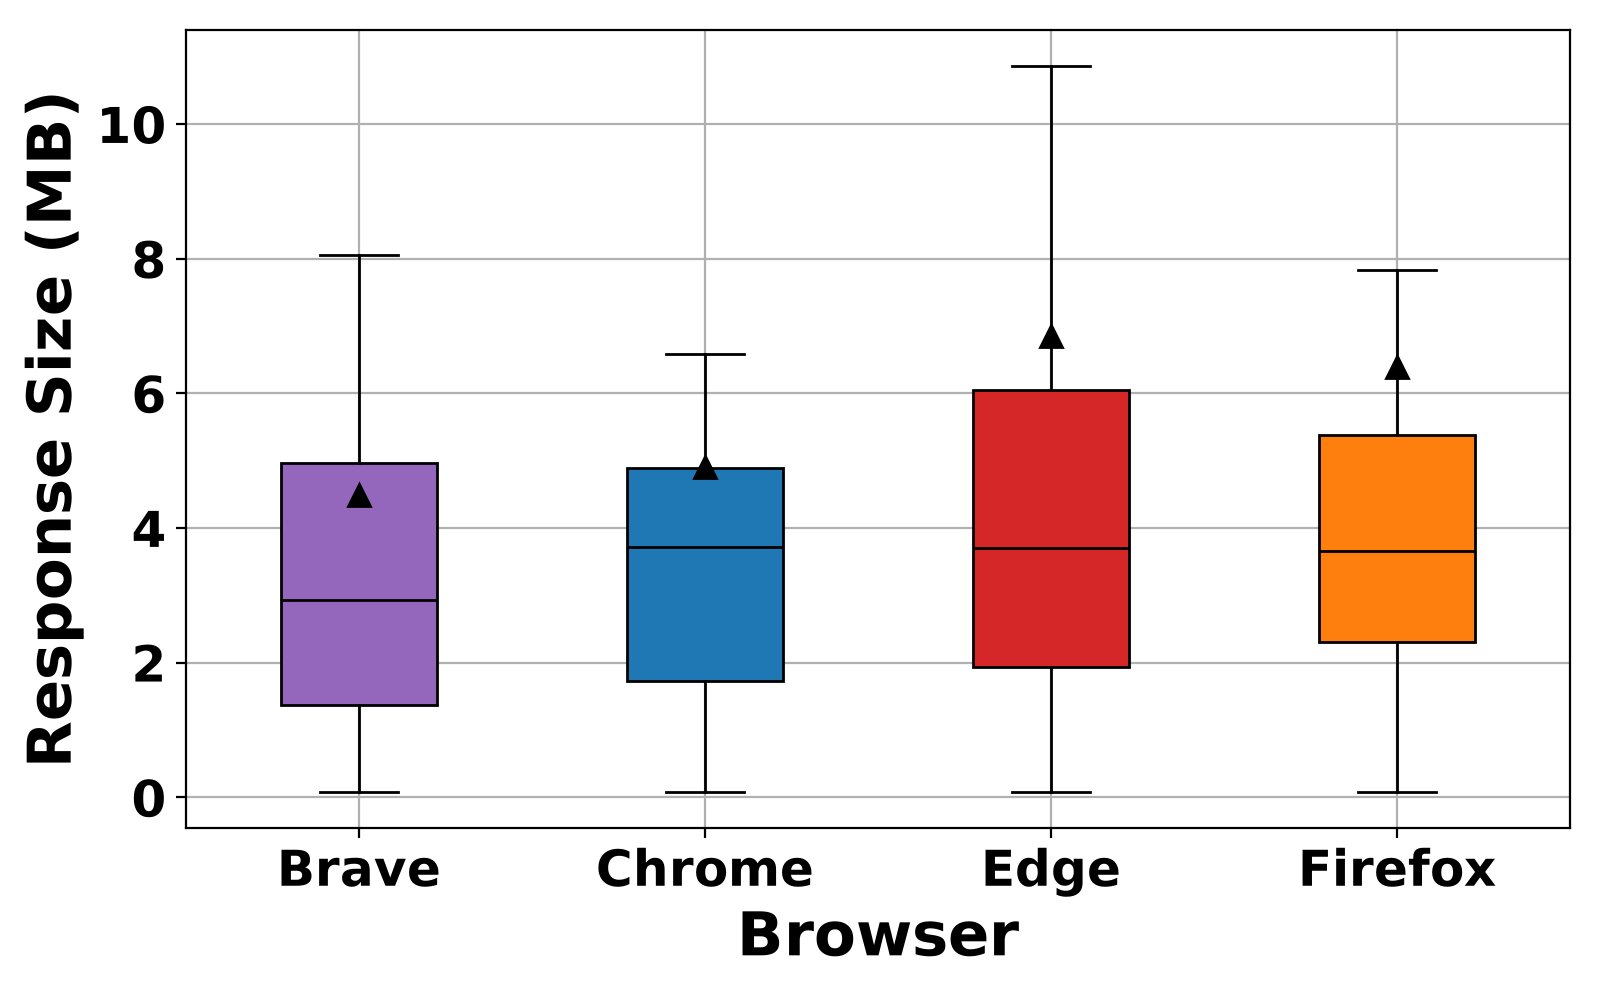
Figure 6 shows the distribution of response sizes (inbound data) per page load. Brave leads with a mean of approximately 4.4 MB, outperforming the competition. Chrome averages ~4.8 MB (9% higher than Brave), Firefox averages ~6.3MB (43% higher), and Edge averages ~6.8MB (55% higher).
Edge and Firefox show notably higher inbound data usage than the two Chromium-based browsers. For Edge in particular, the interquartile range extends significantly higher, indicating that for a substantial proportion of pages, Edge fetches considerably more data than the other browsers. Brave’s lower inbound footprint is a direct consequence of its content filtering blocking ad creatives, tracking pixels, and third-party scripts before they are ever requested from the network.
Request size (outbound data)
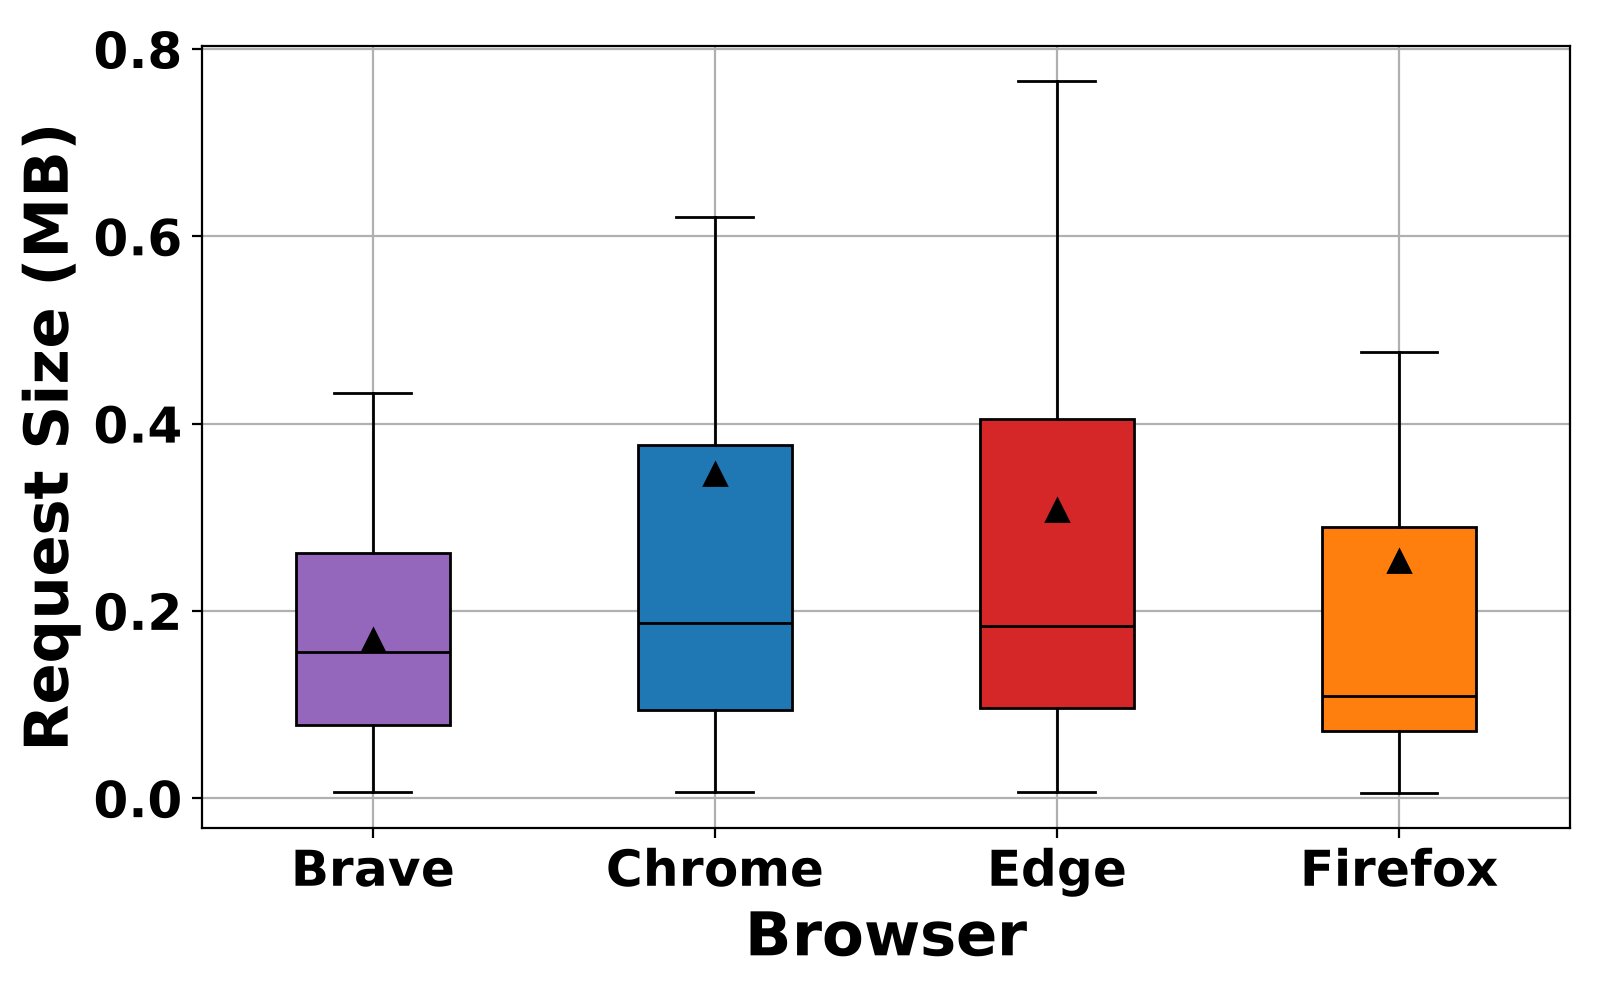
Figure 7 shows the distribution of outbound request sizes per page load. The gap between Brave and its competitors is the most striking of all the network metrics. At a mean of approximately 0.18 MB, Brave transmits the least data by a clear margin — 28% less than Firefox (~0.25 MB), 40% less than Edge (~0.30 MB), and 47% less than Chrome (~0.34 MB).
The outbound gap between Brave and Chrome is particularly large. Chrome transmits nearly twice as much data per page on average, reflecting the volume of tracking beacons, telemetry pings, and analytics payloads that Brave blocks before they leave the device. Reducing outbound data is of course meaningful for privacy. But, as proven here, reducing outbound data also reduces upload bandwidth consumption and the CPU overhead associated with serializing and sending those requests.
Synthetic benchmarks
While real-world browsing metrics are our primary focus, we included results from three widely used synthetic benchmarks for completeness: Speedometer 3.1, which measures how quickly a browser executes JavaScript-based web applications; JetStream 2.2, which evaluates JavaScript and WebAssembly performance on computationally intensive tasks; and MotionMark 1.3.1, which tests graphics rendering performance at 60 frames per second.
As noted earlier, these benchmarks omit the factors that drive real-world performance differences: namely privacy protections, adblocking, and network optimization. They are also ill-suited for comparing browsers that share the same underlying engine: because Brave, Chrome, and Edge all run on Chromium, their scores on engine-focused tests naturally converge, regardless of the meaningful differences in how they behave during actual browsing.
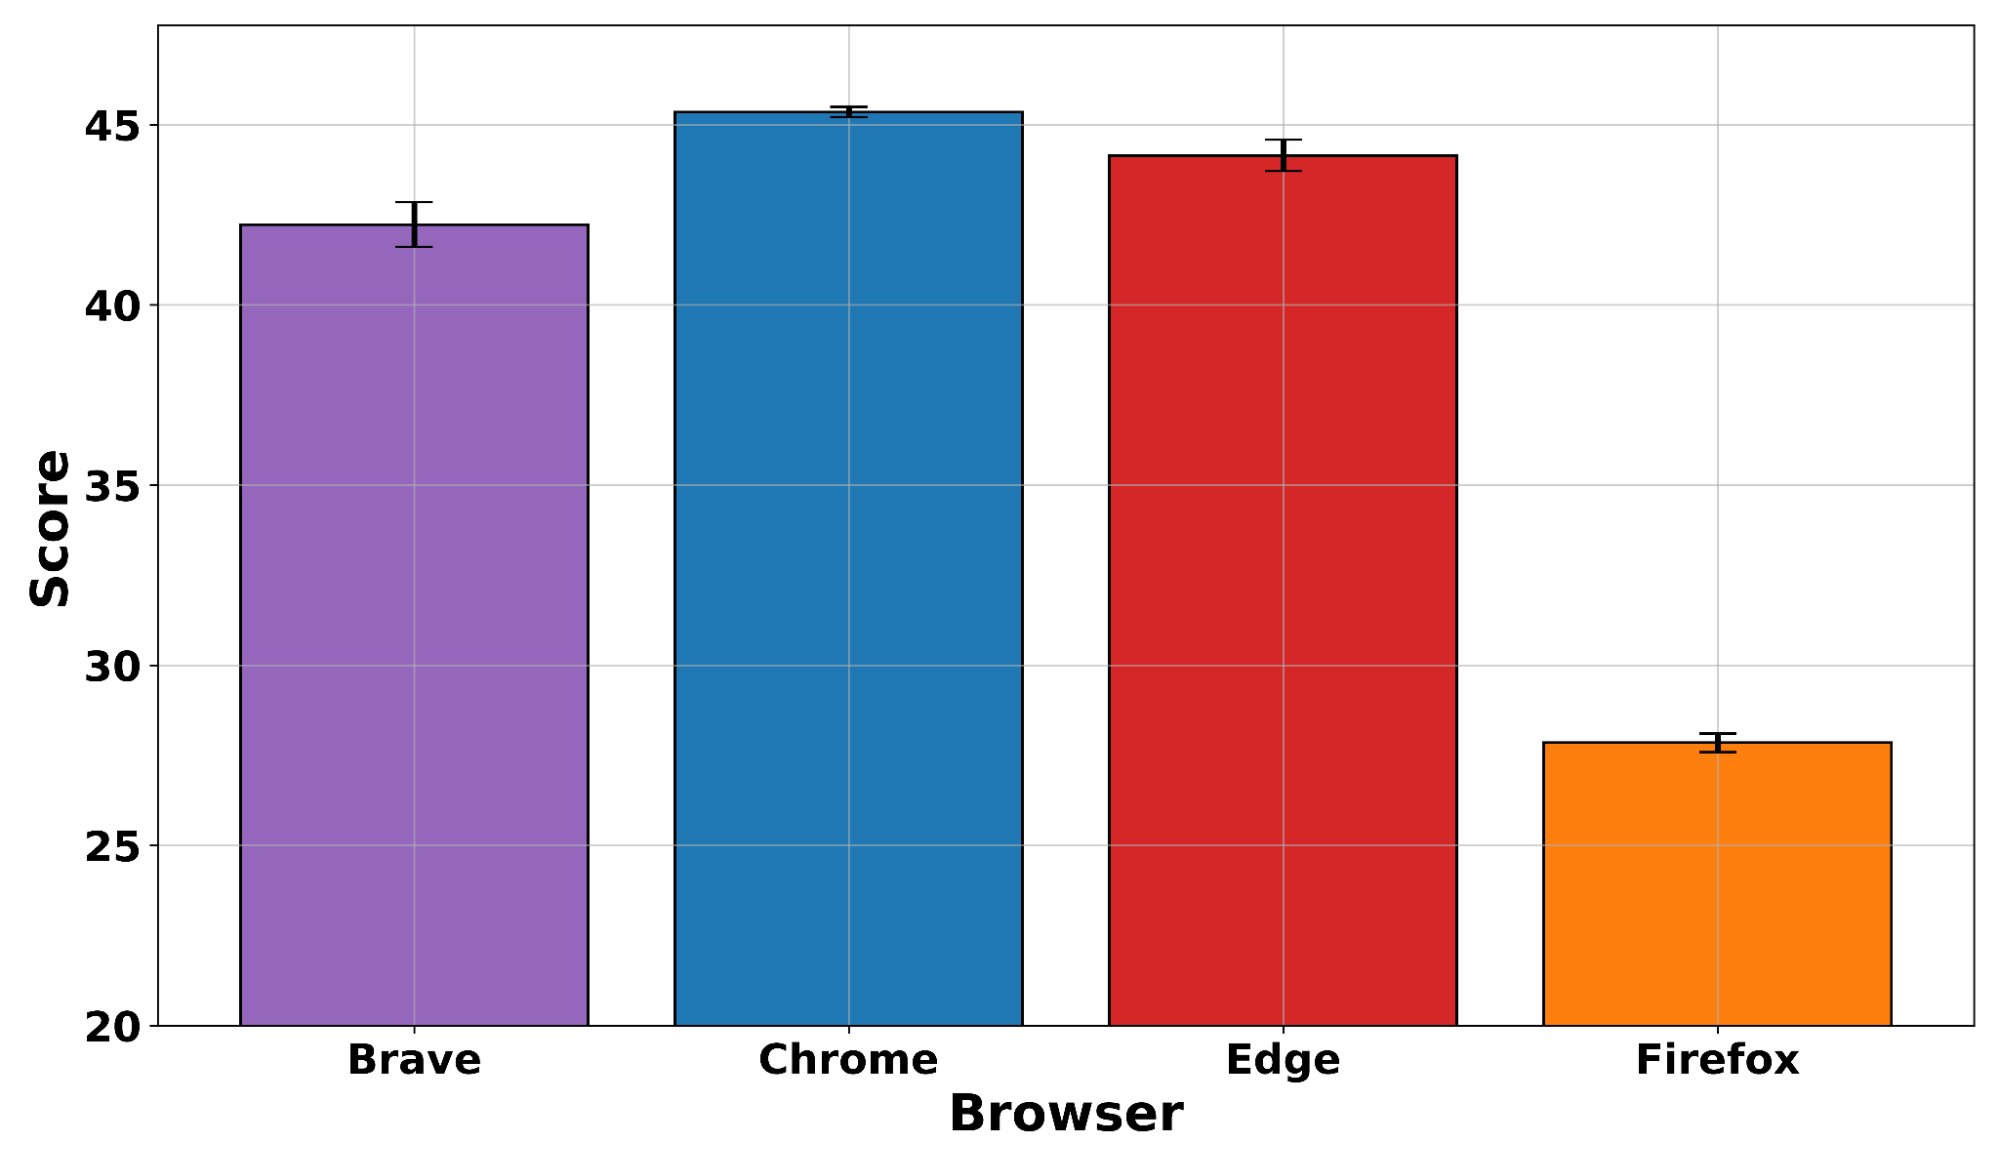
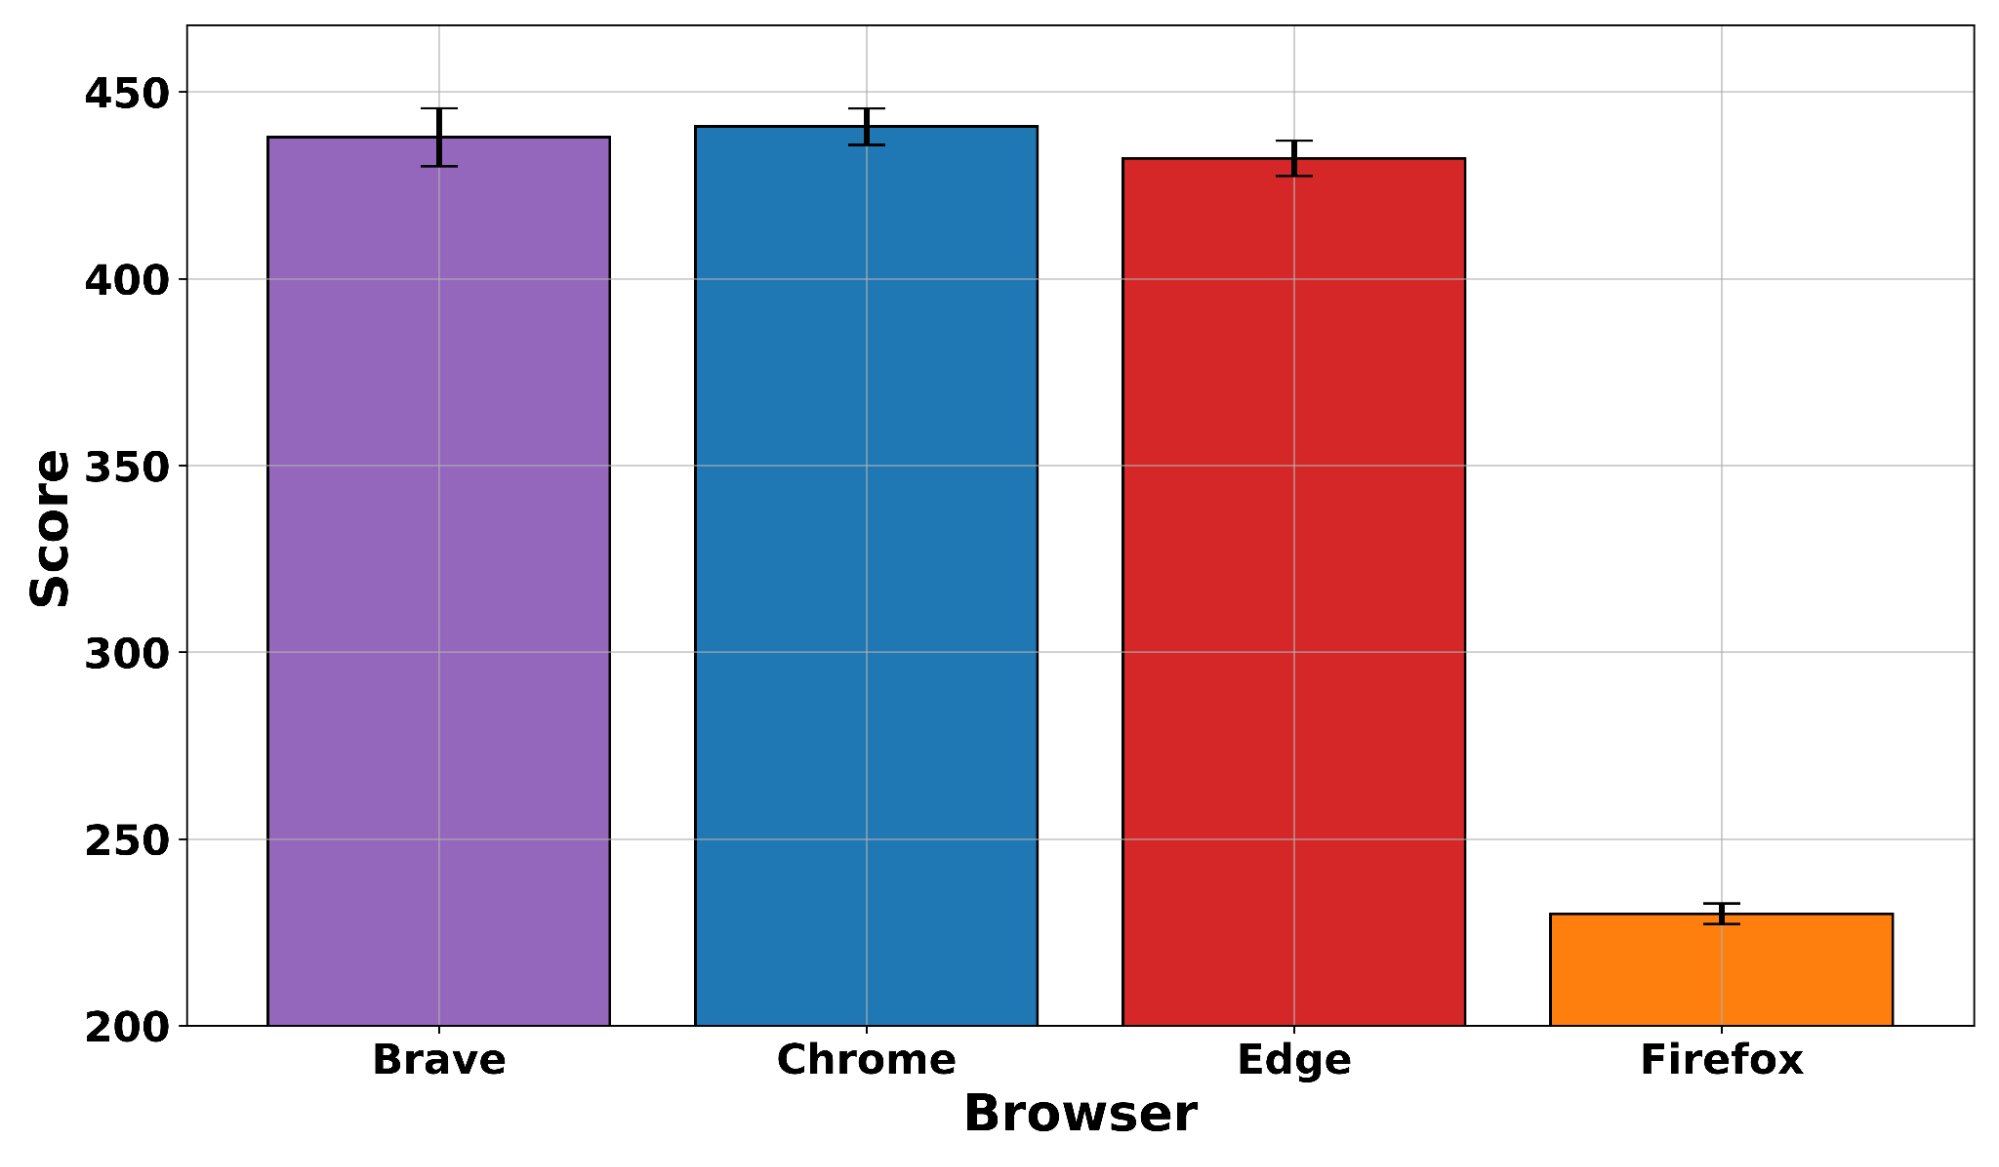
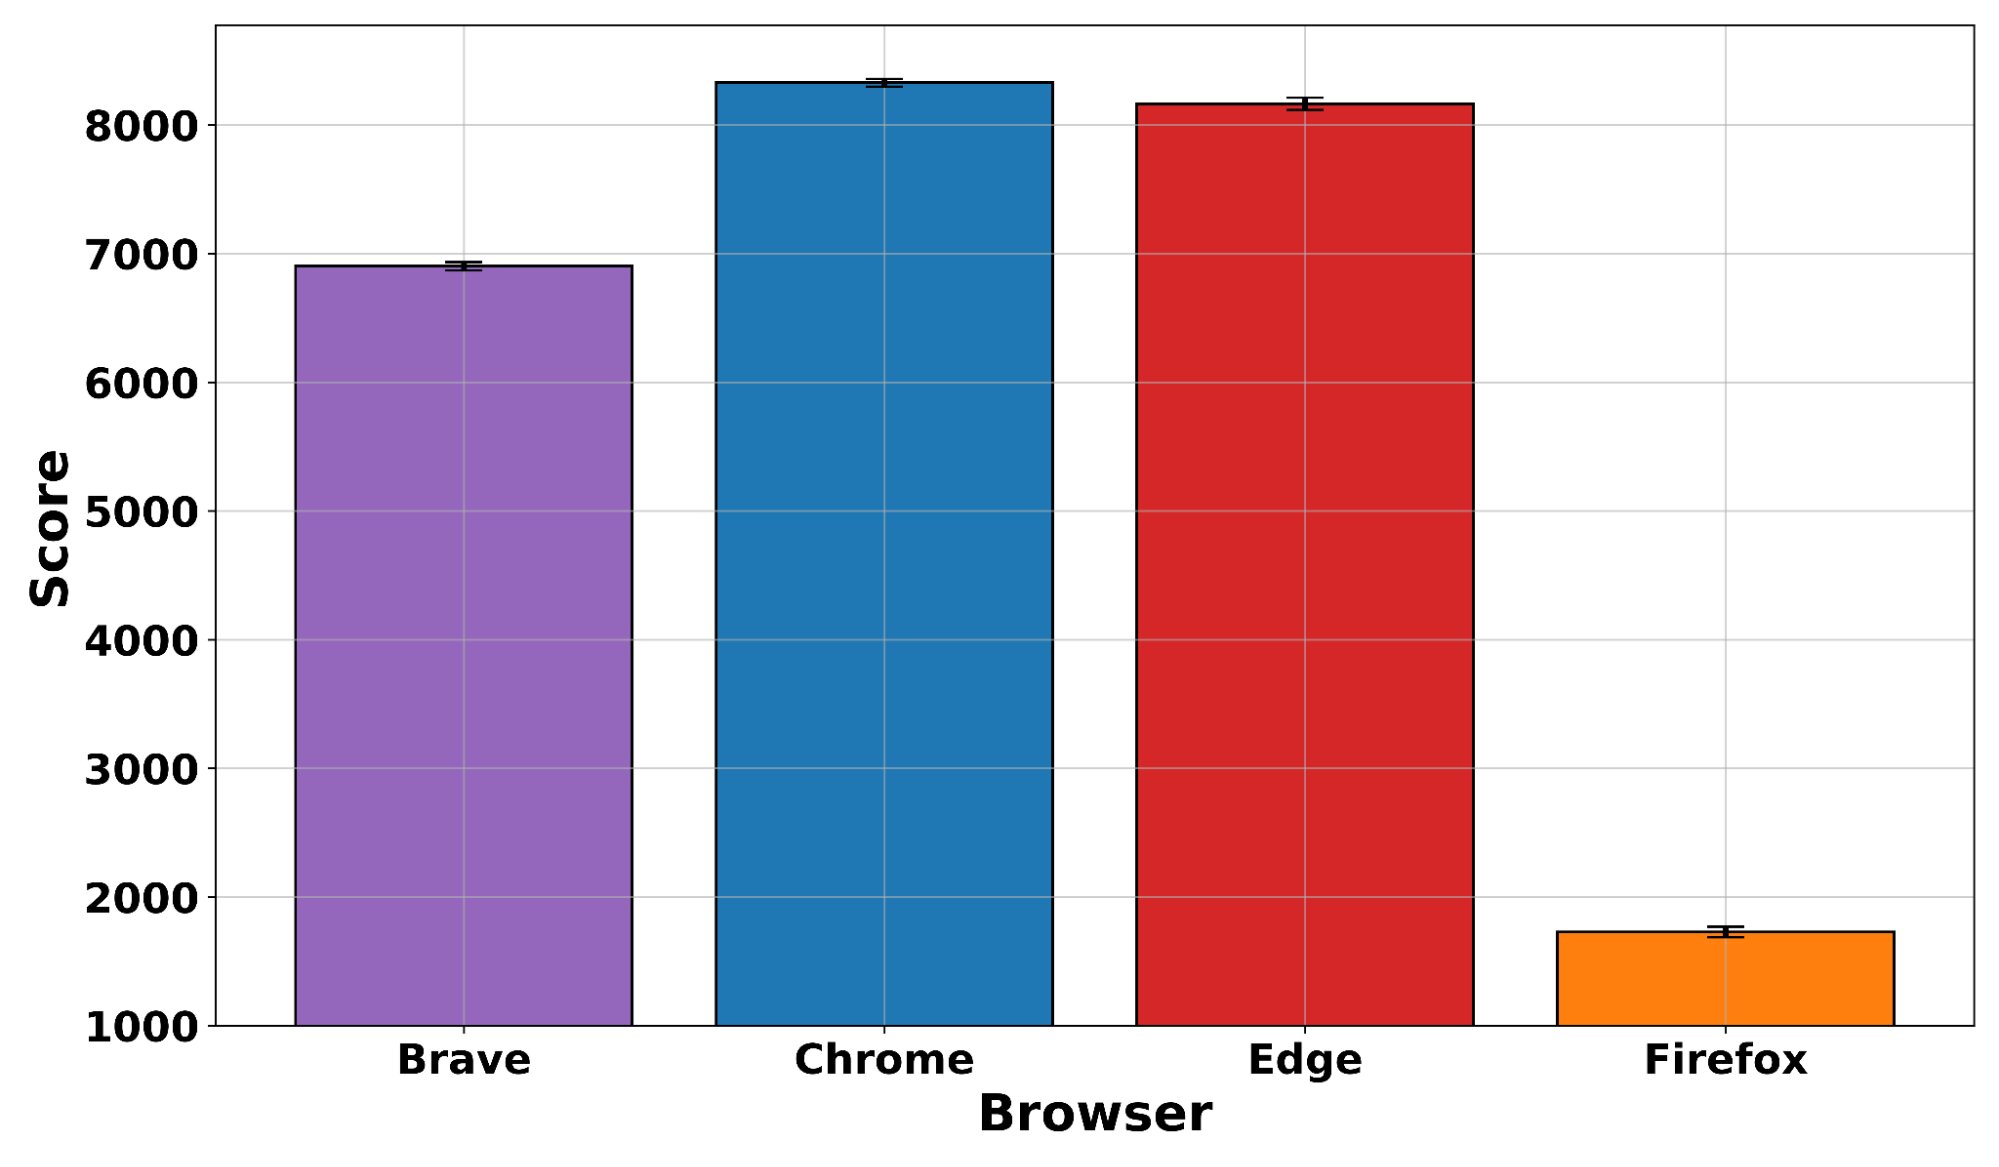
The results reflect this pattern. On JetStream 2.2 (Fig. 8b), Brave, Chrome, and Edge are statistically indistinguishable, with Firefox lower due to its different engine architecture. Speedometer 3.1 (Fig. 8a) shows a similar picture: Brave, Chrome, and Edge cluster tightly together, with Firefox trailing. MotionMark 1.3.1 (Fig. 8c) follows the same Chromium-cluster pattern for Chrome and Edge, though here Brave scores somewhat lower, likely reflecting the overhead of its additional privacy features on graphics-intensive rendering. Firefox scores substantially lower, again reflecting engine differences.
Why these four browsers?
We evaluated four browsers in this study: Brave, along with three other cross-platform browsers. We measured Chrome and Edge because of their worldwide popularity; we measured Firefox because it’s both built on a different browser engine (Gecko), and because of the prominence of privacy in the browser’s positioning and marketing.
We considered but ultimately did not include several other browsers in this comparison. Most significantly we did not include Safari (or any other WebKit-based browsers) as the measuring framework we used, Playwright, only provides access to a wrapper around the WebKit engine, which is not equivalent to measuring Safari itself. Other frameworks that can measure Safari do exist, but they do not provide the same set of features and capabilities needed by our measurement system (e.g., measure request/response size per url).
Conclusion
Across every resource metric we measured (energy, CPU, memory, page load time, and bandwidth), Brave is the most efficient desktop browser in our evaluation. The margin varies by metric, but the direction is consistent: Brave outperforms Chrome, Edge, and Firefox in real-world browsing conditions on macOS.
These advantages are a direct consequence of the privacy and performance features Brave ships by default: native ad and tracker blocking, fingerprint protection, and bounce tracking defenses that reduce the computational and network overhead of every page load. Key findings from our tests include:
- CPU Efficiency: Brave uses on average 44% less CPU than the competing browsers, with Firefox showing the largest gap at 2.4× higher consumption.
- Memory Footprint: Brave is the most memory-efficient browser tested, using 28% less memory on average than Chrome, Edge, and Firefox.
- Energy Consumption: Brave consumes 10% less energy per page load than the average of competing browsers.
- Network Efficiency: Brave transfers 26% less inbound data and 39% less outbound data than other browsers.
- Page Load Speed: Brave loads pages 20% faster on average.
We plan to continue this evaluation series with a similar set of tests for iOS, and to periodically re-run tests across all platforms to ensure Brave remains the most performant major browser available.
For questions or comments about the results of this post, please contact the Brave Research team at blade-project@brave.com.

