The New Brave is 22% Faster
Newly Redesigned Chromium-Based Brave Browser Has 22% Faster Load Time than Brave Muon Version, on Average
This research was conducted by Andrius Aucinas, performance researcher at Brave, and Dr. Ben Livshits, Brave’s Chief Scientist.
Back in March we announced the development timeline for the newly redesigned Brave 1.0 browser for desktop operating systems, one that uses Chromium’s native interface and that supports nearly all Chrome features and extension APIs (referred to as Brave Core in this article). In addition to featuring leading privacy and security benefits, Brave Core (the latest milestone is available for download here) is showing radical performance improvements (beyond what is achieved by simply blocking unwanted content), offering average and median load time savings of 22%, which translates into as much as 8-second faster page loads on certain sites. In this post, we take a detailed look at Brave Core performance improvements and how this new version is going to benefit the user. Our main focus is on page loading times and our “weapon of choice” is the tracing infrastructure exposed by the underlying Chromium code base, which exposes detailed performance timelines. Future posts will address performance results on mobile devices, memory consumption, as well as comparisons with other leading browsers and general benchmark testing.
Our Methodology
Browser performance is mainly measured across 2 metrics: how quickly it loads the pages and how much resources, mainly CPU, it uses. Both of them directly depend on the content loaded as well as network conditions. All tests were performed on a Macbook Pro laptop with Intel Core i5, dual-core CPU and compared Brave 0.24.0 version against Brave Core 0.55.12 Beta release.
Update: Note that we are comparing released versions; Brave 0.24.0 is based on Chromium build 69.0.3497.100, while Brave Core 0.55.12 uses a newer Chromium build 70.0.3538.45. We do not expect the move to a later underlying Chromium version to be responsible for significant performance variations. We don’t observe a statistically significant difference for unthrottled measurements—in fact, Chrome 70 is sightly slower for the sites we considered.
Network
An inherent property of computer networks is their varying performance – latency and bandwidth can both change quickly and there are no minimum quality of service guarantees. This combined with varying server response times and even more – different content delivered in response to subsequent requests create some challenges in detecting performance differences due to changes in the application itself.
To minimize network variance we use a Web Page Replay tool WprGo created by the Catapult project for Chrome benchmarking purposes. We first run it in record mode, with a clean instance of a web browser, with no resource blocking or extensions and network caching disabled, instrumented to visit websites we want to use for testing instrumented to send all requests instead to the local WprGo proxy. This creates a web resource archive that can be used in replay mode to pretend to be the original server. There are of course some caveats in using the approach: the replay server can only use self-signed SSL certificates, therefore the browser being tested should be configured to ignore SSL errors. In addition, some network resources may not have been previously recorded as they are loaded by JavaScript and may depend on current time or randomization. That is mitigated by overriding date and random functions to use fixed values as well as responding with Page Not Found for any resources that still could not be located in the archive. We observe mostly advertising-related requests being missed by the replay proxy, and they would be blocked by Brave Shields anyway, minimizing the impact on performance. Nevertheless, the non-determinism and time-dependence of some resources in modern pages mean that pages cannot be replayed perfectly using this approach and we would miss some details in the replayed sessions.
Web crawling
We look at Alexa News Top 10 for this post, as they are frequently visited by a lot of people, but are still run by reputable companies that pay attention to their readers. The top list at the time of testing was (descriptions provided by Alexa):
- Reddit.com – User-generated news links. Votes promote stories to the front page.
- Cnn.com – News, weather, sports, and services including e-mail news alerts and downloadable audio/video reports.
- News.google.com. Aggregated headlines and a search engine of many of the world’s news sources.
- Nytimes.com – Online edition of the newspaper’s news and commentary.
- Theguardian.com – Home of the Guardian, Observer and Guardian Weekly newspapers plus special-interest web sites.
- Indiatimes.com – Covers home and international updates, sports, entertainment, health and lifestyle. With sections for weird and trending news.
- Weather.com – Offers forecasts for cities worldwide as well as radar and satellite maps. Also includes news stories and allergy information.
- News.yahoo.com – Daily news and full coverage of current issues.
- Washingtonpost.com – Daily. Offers news, opinion, sports, arts and living and entertainment. Includes archives since 1977 and subscription information.
- Foxnews.com – Breaking News, Latest News and Current News from FoxNews.com. Breaking news and video. Latest Current News: U.S., World, Entertainment, Health, Business, Technology, Politics, Sports.
The sites that are crossed out have paywalls or consent / GDPR compliance walls when visited from Europe and are excluded from further evaluation.
We measured page load times across both browsers using the built-in developer tools, with load times exposed with standard Performance.timing APIs supported by all browsers. While Brave Core makes a lot more sophisticated instrumentation possible, not everything is available on the older version, and we used the manual approach to maintain identical measurement methodology.
Realistic conditions: using mobile settings to reproduce desktop throttling
Developers often forget that while themselves and many power users may be tech-savvy and own the latest hardware – the reality is that the majority of people might not have the latest computers on the fastest networks. It’s important to think about these devices when building for the web, and especially so for Brave, with the browser very popular among mobile users. Although a proper deep-dive into mobile web performance is due in a separate article, we also look at the effects of Brave Core performance changes in realistic environments.
Ben Schwarz in his 2017 article on real world performance compiled some information on real network access out there, with a few pieces of shocking news: 60% of the world’s average mobile connections are 2G and the cost just 500mb of data can be a few days worth of work for some people in India, Brazil or Indonesia. Suddenly a fast 3G connection sounds pretty good!
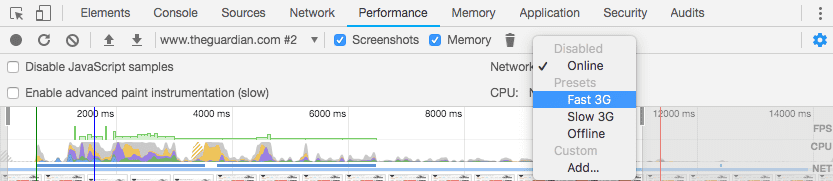
What does a “Fast 3G connection” mean exactly? The actual settings used by the WPO Foundation (who run the webpagetest.org) are:
- Latency: 150ms
- Throughput: 1.6Mbps down / 750 Kbps up
- Packet loss: none
The same settings are used in Google Lighthouse throttling. Among other limitations, the browser does throttling at request level, rather than packet, which would leave the throttling presets too optimistic, and the Chrome team have worked out that they should use latency and throughput multiplier factors of 3.5x and 0.9x in Lighthouse as well as Chrome to simulate realistic network conditions.
The reality of devices used also has impact on how fast most of the users’ devices can process content once it has been downloaded. Addy Osmani published an analysis last year on JavaScript start-up performance across a range of devices. While one takeaway is that mobile devices are a lot slower (2-5x for just parsing and compiling JavaScript) than desktop, another one is the huge range of the slowdown. We therefore can’t expect the straightforward approach of slowing down the main thread to be representative of every device, but the standard presets in Chrome of 4x and 6x CPU slowdown seem to correspond to high-end and low-end mobile devices respectively.
We separately tested our chosen websites with webpagetest.org to confirm the choice of throttling settings with two devices: iPhone SE and Motorola Moto G4. Over 21% of iOS users are still using the iPhone 6s / 6s Plus / SE (all with the same chipset) and the Moto G4 is often the choice for a mid-range, budget Android device. We compared the times of loading live versions of the chosen websites on a Fast 3G connection using standard web browsers (Safari for the iPhone and Google Chrome – for Moto G4) when comparing the upcoming Brave 1.0 browser with 4x and 6x CPU throttling. As expected, there is a lot of variance when comparing real load times against emulated ones, however the Moto G4 is slower than the iPhone, iPhone is closer to 4x CPU throttling and Moto G4 – to 6x.
Overall throttling does give us an idea of how the browser performs on a “much slower device”, but we shouldn’t expect direct per-site comparison to be accurate as the results are noisy when compared to real mobile devices. We hypothesise that some of the bigger differences are due to natural performance variations across the browsers, e.g. on foxnews.com, Safari appears a lot faster than Google Chrome. Chrome’s approach of emulating mobile CPU by simply slowing down the main thread running on a multi-core x86 CPU is only meant as crude approximation of the actual performance a generic resource-poor device that might be running on a lower-frequency ARM CPU with a completely different architecture.
Comparing load times
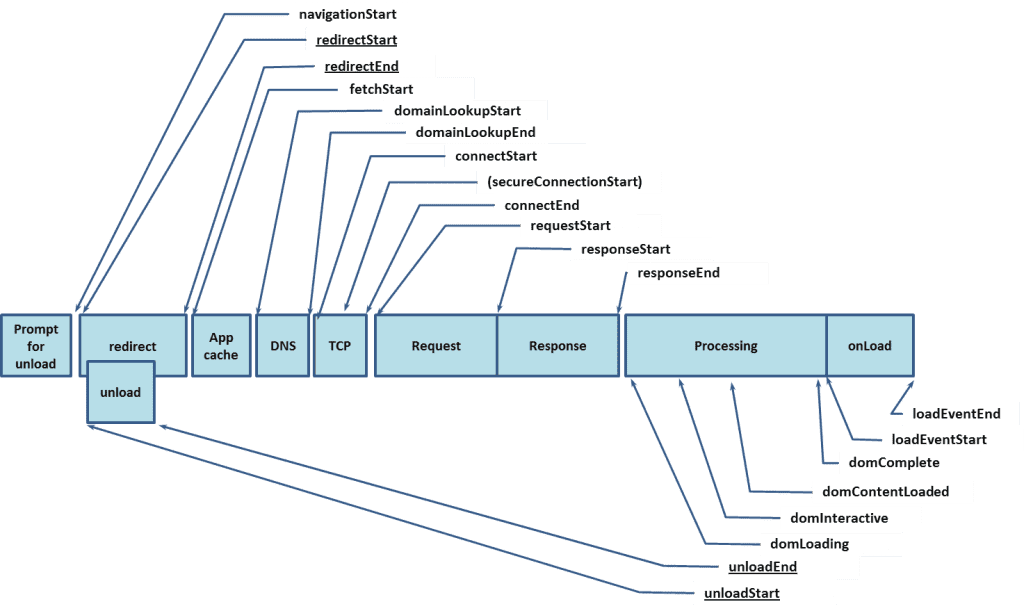
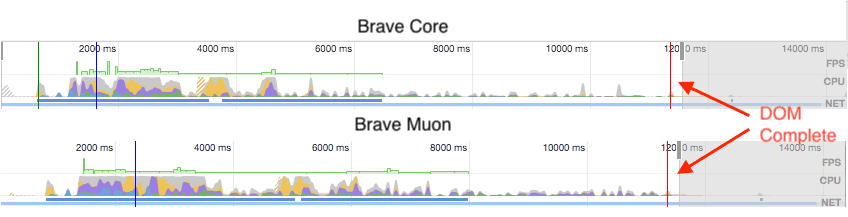
The metric that is most visible to users is overall page load time as measured by wall clock time. Different metrics can be used to measure perceived loading speed, including ones that look at when most of the visible page has finished painting or when the page is sufficiently interactive to be usable. For comparison between our two browsers it is most appropriate to focus on the overall loading time however, i.e. when the entire DOM was complete, from Navigation Timing Recommendation:
Load Time Gains
We measured page load times on both Brave Core and Muon-based Brave to see if there are any differences, unthrottled (running on a laptop, with all requests served locally from a replay cache) as well as with the different permutations of network and CPU throttling. As mentioned before, some content cannot be replayed completely deterministically and we see some missed content in page traces, e.g. in the case of theguardian.com 4 requests out of more than 260 fail to be replayed.
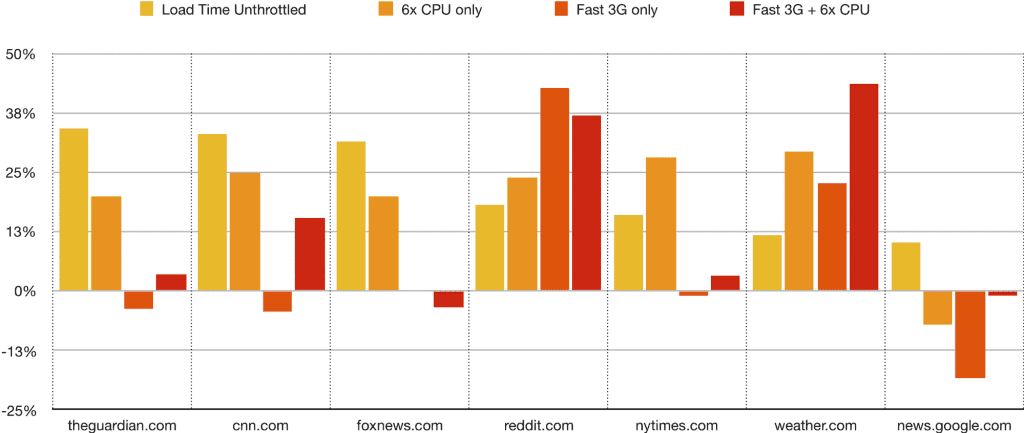
Slightly surprisingly, the unthrottled case also demonstrates the biggest relative gains, with the tested pages loading 22% on average (with 18% median), which saves between just 100ms for weather.com and up to 1.3s for Fox News, half a second in the median case. When only CPU is slowed down by a factor of 6, the saving is still around 20% on average (24% median), but the absolute saving goes up to over 4 seconds in the best cases, however for Google News we observe a performance degradation. Noticeably, Google News adds last bits of styling by lazy-loading some images and stylesheets after a delay, annotating stylesheets with “data-late-css”, and CPU throttling appears to be interfering with the specific way of late-loading the less critical resources.
While load times due to network throttling can be affected by the changes in how ad-blocking is done within the new browser core, in some cases with both network and CPU throttling we see very small gains or losses that can be attributed to measurement noise. In some cases, the total difference adds up to 9.3s for weather.com and 12.3s for Reddit. This is caused by a combination of how the different bottlenecks in loading a page actually change depending on processing and network speed, as well the limitations of the throttling approach. In fact, the differences with real mobile devices on webpagetest.org highlight the necessity to test on specific hardware, as the very crude approximations do not necessarily paint a realistic picture.
The Details
The browser rendering pipeline is complicated, so it is tricky to measure where the savings come from when loading a webpage. Webpage loading becomes an intricate interaction between the network, and the CPU executing JavaScript, building the DOM, styling, layout and rendering. The discrete steps in rendering a webpage, although not strictly sequential are:
- Execute JavaScript – executing (but not necessarily compiling) JavaScript, including any state manipulation, “virtual DOM diffing,” and modifying the DOM.
- Calculate style – taking a CSS stylesheet and matching its selector rules with elements in the DOM. This is also known as “formatting.”
- Calculate layout – taking those CSS styles we calculated in step #2 and figuring out where the boxes should be laid out on the screen. This is also known as “reflow.”
- Render – the process of actually putting pixels on the screen. This often involves painting, compositing, GPU acceleration, and a separate rendering thread.
Using browser performance tools, we looked at the details of two pages: 1) theguardian.com, because the savings are very different in throttled and unthrottled cases, and 2) reddit.com, because the savings are big in both cases. It is worth noting that performance tracing adds overheads of its own, so the numbers are not directly compared to the tests above with tracing disabled.
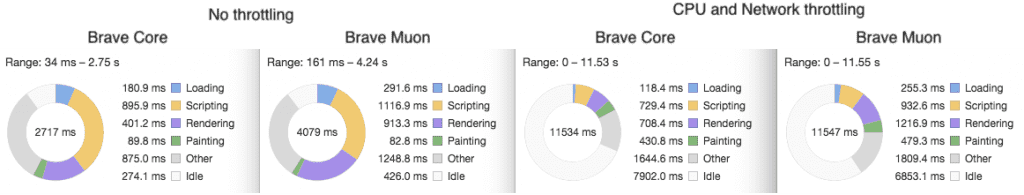
When loading The Guardian with throttling, Rendering and to some extent Scripting and Loading consumed more time, however with network as the bottleneck their impact on load time was hidden. This difference in CPU use, although not necessarily noticeable for the user, would add up to significant differences in energy use, or cause more prominent effects when browsing on a faster network. This is why with no network limitations the difference in load time becomes large, adding up across Loading, Scripting, Rendering and Other tasks with virtually the same idle time.
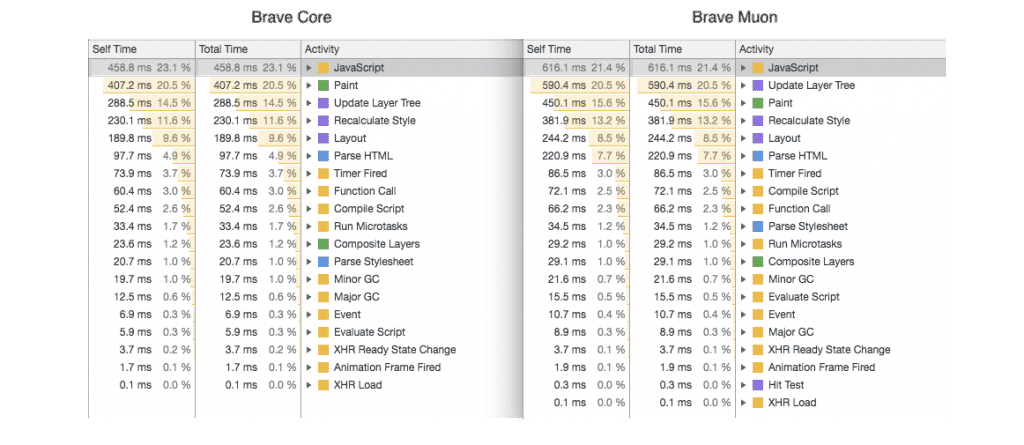
It is also worth taking a look at a more detailed breakdown of what the browser spent its time on in the “Bottom-Up” view, which provides further details on the computational tasks of loading a web page. It is worth noting that at this level of detail, the measurements can be quite noisy as it is extremely difficult to instrument the browser with little performance penalty as well as to control the environment to minimise variance. Not shown in the figure, the differences in JavaScript execution or HTML parsing times are relatively small when comparing throttled and unthrottled cases, with throttled case sometimes being faster. Painting times, on the other hand, demonstrate slowdown similar to the CPU throttling factor, pointing to some of the limitations of the approach. Nevertheless, the measurements demonstrate clear improvements across the major webpage rendering tasks, especially parsing and styling ones.
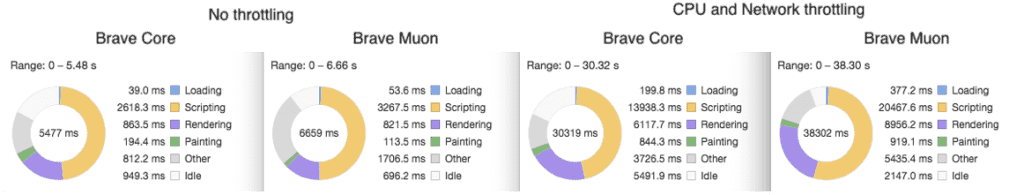
In the case of Reddit, the most notable difference is in time spent on Scripting as well as Rendering – with CPU throttling those differ by over 6 seconds and almost 3 seconds respectively, with a few more spent on Other tasks. Without CPU throttling, the differences in Scripting and Other tasks cover most of the difference in overall loading time. With the computationally heavy site Brave Core improvements in rendering tasks deliver as much as 8 seconds faster page loads with no additional ads or trackers blocked.
Conclusions
We found a number of interesting results when comparing the upcoming Brave 1.0 browser with the current version of Muon-based Brave on a desktop (laptop) computer. We also looked at what performance might look like on a much slower device by emulating CPU and network slowdown.
- Savings on the desktop: For today’s common laptops with fast connections, we observe load time savings of 10% – 34% on the tested popular media websites with same page content and blocking. Average and median load time savings are 22% and 18% respectively.
- Slower Environments: For slower processors similar to what is found on today’s average Android device on a fast 3G connection, our savings range up to 44%, with the mean and median of 14% and 4% respectively.
- Improvements: Since the blocking functionality is the same across the two browsers, the time savings we observe come from a range of improvements across HTML parsing, JavaScript execution, page rendering, etc.
- CPU utilization: CPU utilization is better in Brave Core, with all computationally intensive tasks running faster across all tested websites and configurations. We plan to explore the importance of multi-core capacity on the browser speed in an upcoming post.
- Emulation: Emulating hardware and network conditions real users are likely to use helps us see a realistic picture of browser performance improvements. We plan to provide a much more detailed look at mobile performance in the future.
In future posts, we plan to explore performance measurements on mobile devices, for a much more detailed look at what real users gain from using Brave on their mobile devices. We will also be writing about improvements in memory consumption and the importance of multi-core capability on browser speed. Finally, with the recent improvements in browser performance with Brave Core, we have a great platform for further privacy and performance features, some of which we have already written about and some in the works. We will be writing about them too, so stay tuned!