Brave 1.0 Performance: Methodology and Results
Keeping the web open to everyone with built-in privacy protections and significant efficiency gains
This blog was written by Dr. Andrius Aucinas, Dr. Matteo Varvello, performance researchers at Brave, and Dr. Ben Livshits, Brave’s Chief Scientist.
In 2019, Brave reached a major milestone with the release of the 1.0 version. As ever, web browsing performance is a key priority for Brave, so we set out to evaluate in detail how it stacks up against the competition and devised a methodology for doing so. In our “1.0 reviewer guide”, we summarized the significant savings Brave users can expect. In the spirit of transparency, we here present our methodology and detailed results.
Brave is open source and is built on top of two other open source projects: the Chromium project and the Blink rendering engine. The Chromium Project was established by Google, based on Apple’s WebKit. The goal was to take the work Google had done building Chrome and create a shared core for any browser which wants to use it. Chromium is now the building block for most contemporary web browsers. Using Chromium as a foundation lets Brave’s small team focus on building the powerful features which set the browser apart rather than the core web-browsing experience shared by all browsers.
Most websites try to send large amounts of data, of which only a little is the “stuff” the user actually wants to see. The rest is advertising, trackers, and other material which takes extra time and data to download, occupies space in memory, and needs more CPU time and power to process. Because Brave blocks third party all of that out of the box, it’s considerably faster than other browsers. And that’s doubly true on slower or laggier connections where every bit counts, or older devices where every stray CPU cycle or bit of RAM rapidly adds up.
For the 1.0 evaluation, we put together a comprehensive testbed, pitting Brave against Chrome, Firefox, Opera, and Edge on Windows, MacOS, and Android. We use the testbed to compare these browsers across memory use, page load speed, data and power use, as well as traditional synthetic benchmarks. We discuss in detail the methodology and techniques that we used in working out the savings we wrote about at 1.0 launch: that Brave ends up loading popular web pages 3x to 6x faster, while using about half the memory and power as well as a third of data, saving seconds of time and megabytes of data for every page load.
Testing Environment
Hardware and Software
The hardware in our testbed included:
- MacOS: 2015 Model with Intel i5 CPU, 16GB RAM, running MacOS 10.14.4. All tests are executed on a fresh MacOS user account, with default settings, and only the browser being tested running.
- Windows: Lenovo Ideapad 110 with Intel i3 CPU, 8GB memory, Windows 10. Tests executed on a fresh Windows user account, with default settings, and only the browser being tested running.
- Android: Samsung J7DUO (2018) equipped with Android 9.0, an Octa-core (2x2.2 GHz Cortex-A73, 6x1.6 GHz Cortex-A53), 4GB memory, and a 3,000mAh battery.
For a given browser, we evaluate its most recent stable version. In the case of Opera and Edge (for desktop), we resort to their Beta version since the stable versions were both behind Chromium/Blink (the common open source engine) compared to the most recent version of Chrome. This was done to ensure a fair analysis given the changes that tend to happen between major releases of Chromium. Below we report the specific version under test for each platform.
- Brave 0.71.97 (Chromium 78.0.3904.50), Brave 1.4.2 on Android
- Both were the release candidates for Brave 1.0
- Chrome 78.0.3904.63, Chrome 78.0.3904.62 on Android
- Firefox 69.0.3, Firefox 68.2.0 on Android
- Opera Beta 65.0.3457.7 (Chromium 78.0.3904.21), Opera 54.0.2672.49578 on Android
- Edge Beta 78.0.276.19 on MacOS, Edge 44.18362.387.0 on Windows
- Safari 13.0.2 on MacOS
Metrics
Our performance evaluation focuses on two main areas: resource usage (CPU, memory, battery) and speed (page load time). With respect to resource usage, the ideal scenario is to monitor all resources across our platforms. This is not always practical for reasons we explain shortly, but we argue it is also not needed.
For example, battery usage is way more important on mobile devices rather than, for example, laptops which are often connected to the power line. Given that accurate battery measurements require connecting a power monitor to a device under test — which is even less practical for a laptop — and given the above argument, we only focus on our mobile platform for this metric. Similarly, memory management is quite peculiar on mobile devices, with background applications aggressively suspended when resource shortage is detected. Accordingly, we only measure memory usage on MacOS and Windows.
With respect to “speed”, there is no single, universal performance metric for a browser or a web page. In the following, we introduce three popular metrics that cover different aspects of web performance:
- First Paint measures how long a browser takes until starting to paint anything on the screen. Similarly First Meaningful Paint measures how long it takes for the biggest paint to happen and SpeedIndex reflects how long it takes for the content above the “fold” to be visually complete. Only First Paint is standardised and available across all browsers.
- Page Load Time measures when the whole document with its subresources is complete. Additional content is often loaded after the document is marked “complete” by the browser, e.g. by application frameworks such as React or AngularJS loading resources on-demand, or trackers and ads injected explicitly after the main page has loaded.
- Fully Loaded Time reflects how long it takes for the network to quiet down. Specifically, the page is considered to be fully loaded when there has been no network traffic for 5 seconds. The aim of this metric is to reflect continued device resource usage instead of user experience.
We find that paint-focused metrics work best on relatively clean pages, but don’t reflect user experience well on pages that install dozens of trackers, load multiple ads above the fold, or show consent notices that cover half the screen. Page Load Time, on the other hand, measures when the core document has been loaded and correlates with loading indicators that users tend to notice. Similarly, Fully Loaded Time, even if not directly noticeable by the users, indicates how noisy a page is and correlates with continued CPU and memory use. We therefore report both Page Load Time and Fully Loaded Time as the key page load performance metrics.
Workload
For our real usage tests we arbitrarily picked 35 URLs across News Articles, News Landing Pages and Shopping Content. The full list is available together with the code we used for the automation.
Using the set of pages we generate different workloads most suitable for each measurement. For browser speed measurements, we load every page separately to minimize their effects on each other. For memory, we look at combinations of different pages and select different numbers of tabs open simultaneously to reflect lightweight, average and power users. We model the numbers of tabs on data collected by Brave’s privacy-preserving product analytics framework: the data shows that 42% of users have 2 to 5 tabs open, while 15% of users have 11 to 50 tabs open!
On mobile, we study the pages across categories under two different automations. First, we assume a simple page load where each page in a workload is loaded sequentially — each time opening a new tab in the browser — for up to 60 seconds. Next, we assume an interactive page load where, after the 60 seconds, our automation emulates some user interaction with the page by scrolling up and down the page for the next 60 seconds.
Desktop Benchmarking
Our testbed for desktop measurements consists of two mid-range laptops, Windows and MacOS. To minimize variability, we set up a fresh user account before benchmarking and install the browsers being tested afresh. We automate all tests with custom shell scripts (Bash for MacOS and PowerShell for Windows) and third-party tools.
We ran our tests over a VPN connection with the VPN server running on an Amazon Web Services server in a US region. This slowed down our fast residential WiFi to about 30 Mbps download and upload speed and 100ms of latency. This isn’t as fast as what you would have on a direct fibre-optic connection, but is still better than what many users experience globally and in the United States. We needed to maintain a location in the US across all tests due to the differences between content served here and in Europe due to much stricter European regulations protecting user privacy.
Page Load Speed
The most noticeable difference to users is Brave’s speed in loading websites. Speed is a combination of different aspects: performance of the device itself and other tasks it might be performing in parallel, performance of the network, the structure of a page being loaded and finally - performance of the browser itself. We strive to evaluate Brave in realistic conditions: on mid-range devices, residential connection speeds and real web pages.
For all desktop tests we used Browsertime, taking care to restart the browser and clear cache before every test. Browsertime itself accesses standardised browser APIs to retrieve page load performance metrics (e.g. Page Load Time) and network request information. We calculate the Fully Loaded Time by analyzing the network request information.
On Windows, Brave is significantly faster than others for both Page Load Time (PLT) and Fully Loaded Time (FLT) metrics: on average, Brave saves 7.2 seconds on PLT and 9.6 seconds to fully load a page. The median case for both is slightly lower at just under 6 seconds, for both. On MacOS, Firefox appears to be trailing the pack, with Brave saving around 13 seconds in both average and median cases on PLT, as well as a whopping 20 seconds on average FLT (16 seconds in the median case).
On MacOS, despite the laptop being slightly more powerful than the Windows one, the picture is pretty similar, the biggest difference being that Firefox performance is more aligned with Chrome and Opera. Nevertheless, Brave still loads pages 10 seconds faster, on average, and 7.5 seconds in the median case. Considering FLT, the difference grows to 13.2 seconds on average and 9.3 seconds in the median case.
Memory Usage
Brave also uses less memory than other browsers, which makes everything else on your computer feel that much faster. Brave comes with bells and whistles enabled and ready to use, most importantly — Shields. Because of this, Brave uses slightly more memory than Chrome with no sites open (297MB for Chrome vs. 167MB for Brave), but that difference goes away as soon as the user opens the first web page and Shields starts blocking things. With as few as 5 tabs open, Brave has 40% - 47% memory reduction compared with Chrome and Firefox.
An apples-to-apples comparison between browsers is really difficult, and others have documented the challenges. Browsers are multi-process applications, and accounting for shared memory as well as its effects on performance of the browser as well as the rest of the system is hard. Secondly, many things can change from one measurement to another, either with the specific page, or housekeeping operations a browser may decide to run at the “wrong” time, affecting the measurement. Finally, the only memory truly wasted is one that is not used: keeping things in memory generally speeds up web browsing because the browser does not need to load information from the much slower disk or even worse - network. Modern browsers also adapt to available memory, using it more liberally when there is lots available and discarding less critical data more aggressively when running with little free RAM.
On the other hand, the trackers used across the web are themselves resource-hungry applications and it is no surprise that blocking them saves significant resources, whichever way you measure it. We mitigate some of the challenges with our testbed setup, with two laptops with different memory size (16GB and 8GB) as well as different operating systems (MacOS and Windows). We report the number most users are familiar with: total memory reported for a group of processes by Task Manager (Windows) and Activity Monitor (MacOS).
We choose random combinations of URLs from our list of 35 across news articles, front pages and e-commerce. We choose 5 random combinations for the different numbers of tabs commonly used by our users:
- Single page (single-1 to single-5) - 26% of users have just one tab open
- 5 pages (five-1 to five-5) - 42% of users have 2 to 5 tabs open
- 10 pages (ten-1 to ten-5) - 16% of users have 6 to 10 tabs open
- 20 pages (twenty-1 to twenty-5) - 15% of users have 11 to 50 tabs open
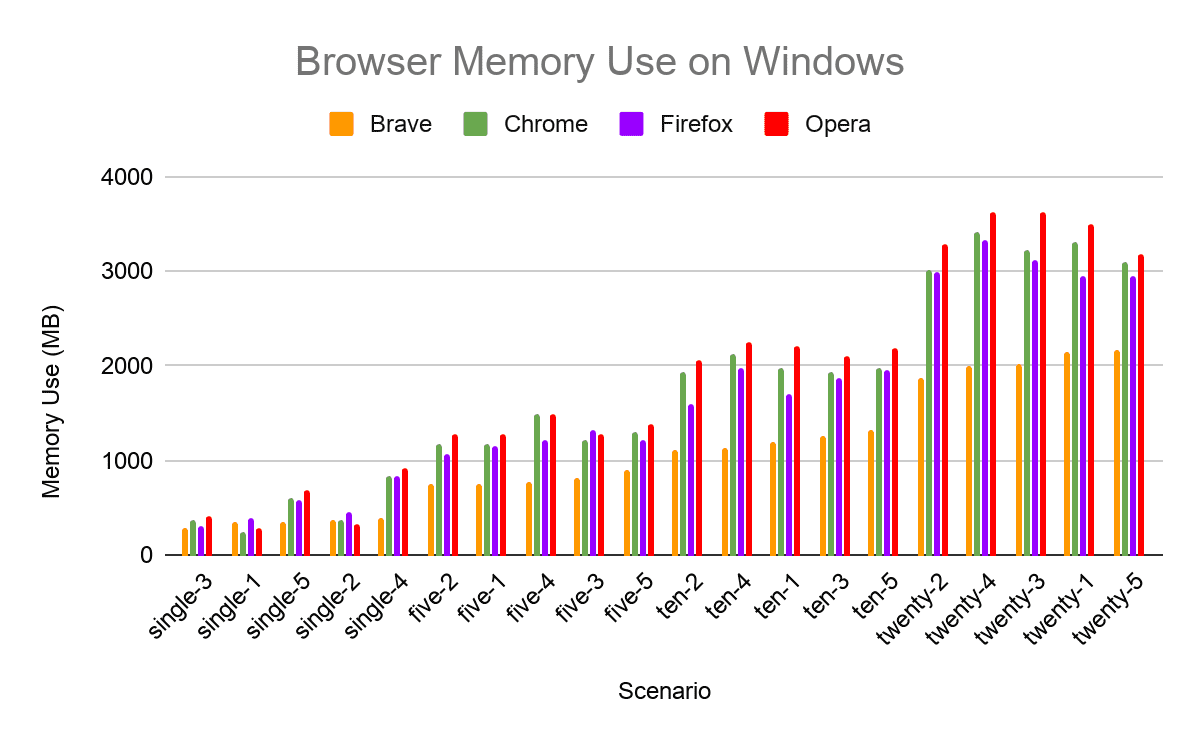
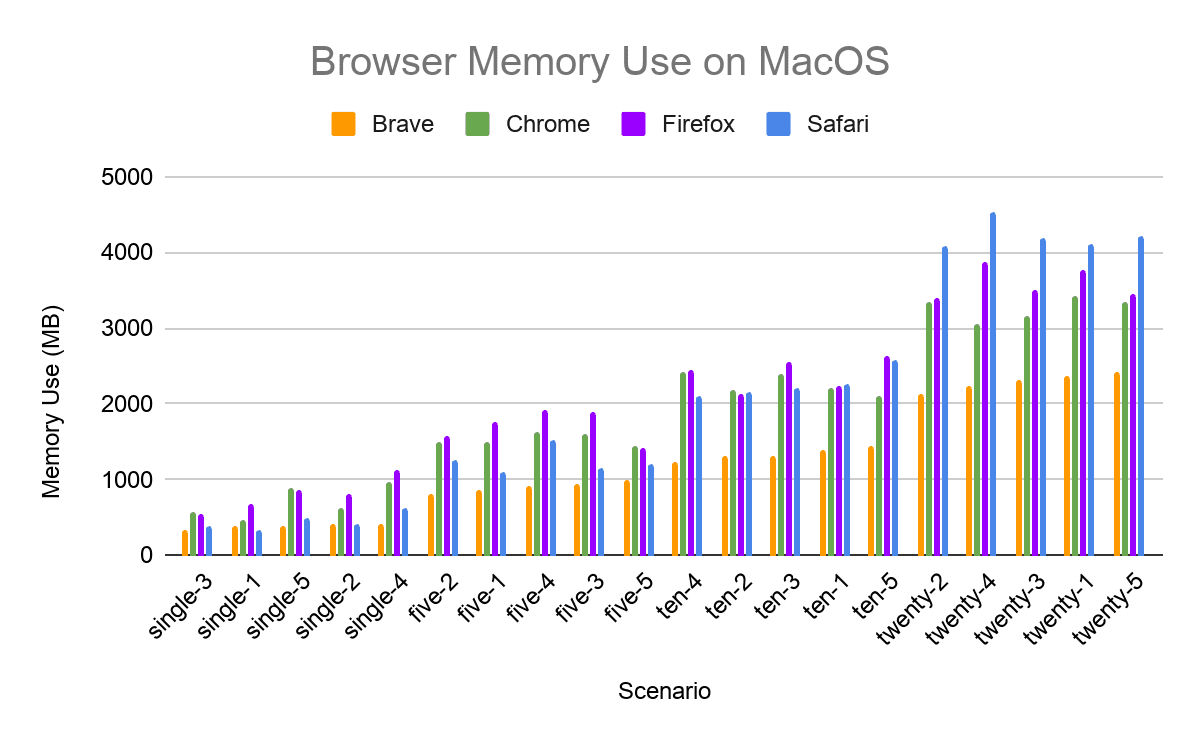
As expected, given the challenges of an apples-to-apples comparison between browsers, the picture changes from one set of pages to the next. For example, Firefox on Windows tends to be slightly better than others, while Safari on MacOS does better until the number of tabs grows to a “power user” level. Brave’s benefit is very clear on the other hand, with less memory used for even 1 page open, and the more tabs - the more noticeable the difference. Since having 2-5 tabs open is the most common case, with 5 pages open on Windows Brave takes up about 800MB on average across the different combinations, while Chrome is 1,270MB and Firefox is 1,200MB. That’s an improvement of more than 33% for Brave over both.
Android Benchmarking
Our testbed for mobile devices currently consists of a recent Android device (Samsung J7DUO, Android 9.0) connected to a Linux machine and a power monitor (Monsoon HV), via battery bypass. The Linux machine is responsible for test automation, e.g., clean a browser’s profile and load a target URL, realized via the Android Debugging Protocol (ADB). ADB is run over wifi instead of USB, to avoid the noise caused by USB powering of the device. The Linux machine is also tasked to instrument the power monitor (e.g., set a target voltage and collect current samples) and monitor the device CPU consumption by sampling /proc/stat (3 seconds frequency).
Performance metrics like Page Load Time and SpeedIndex are collected via separate measurements realized using lighthouse, similarly to what was done for the desktop experiments. In this case, we resort to ADB over USB — since no power measurements are collected — and we forward the developer tool port used at the device (9222) to the Linux machine where lighthouse runs.
In order to minimize measurement noise, before each test we prepared the device using the following best practices. We disable notifications, set the device in airplane mode with WiFi only activated and close all background apps. We then ensure that the device is not using automatic brightness and further set the brightness to a default value (25%). The last step is important since the variation in ambient light can impact the outcome of a measurement and invalidate the battery measurements across different runs.
Energy Consumption (and More)
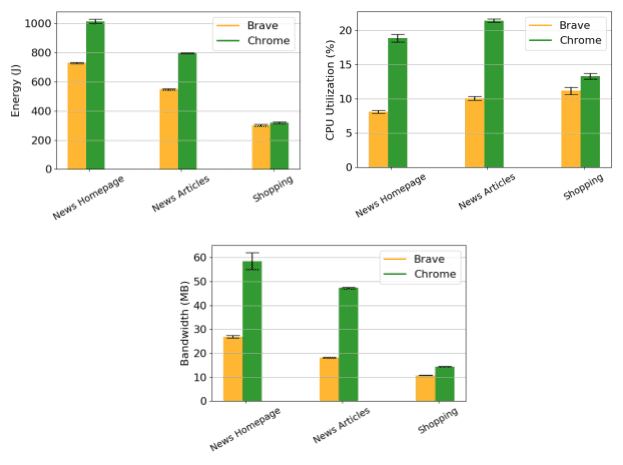
We start by analyzing the performance (energy, cpu, bandwidth) of the three different workloads when assuming the simple load scenario. The figure shows barplots for each metric, browser, and workload. Each barplot shows the average of the metric augmented with error-bars to visualize the standard deviation. The left figure shows battery savings for Brave of respectively 300J (30%), 250J (31%), and 20J (10%) depending on the workload under consideration. To further understand these energy savings, we resort to the CPU and bandwidth utilization plots (on the right). When considering the two news workloads (homepages and articles), the figures show that Brave consumes less than half of the CPU and bandwidth, on average. This translates into about a 30% battery savings. As previously observed via the desktop experiments, the shopping workload is overall more simple and less ads heavy — less than 4MB if we compare Brave’s ads-free experience (10.8 MB, in total) with Chrome (14.4MB in total). For this reason, this workload generates overall lower CPU and battery savings for Brave.
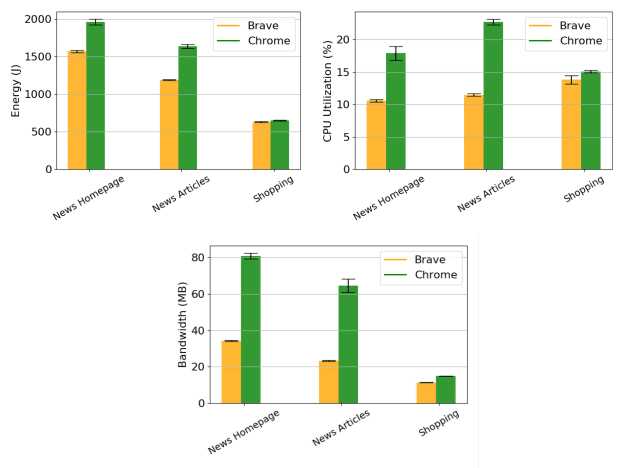
Next, we consider a scenario where the user further interacts with the page multiple times (for an extra 60 seconds after load). It comes with no surprise that the energy consumption overall doubles under this automation as this is related to the resources being used for a longer time, e.g., the screen is active for twice as long. The energy gap between Brave and Chrome remains constant, overall, given that the bulk of work (website loading) was achieved in the first 60 seconds. Indeed, when comparing the CPU plots between the simple and interactive workloads, the difference is only marginal. There is instead an increase in bandwidth consumption due to extra content being downloaded as it is progressively needed on screen. This increase is especially noticeable for Chrome. For example, the bandwidth consumption during the news homepage workload increases by 22MB (58 to 60MB) while it only increases by 8MB for Brave (26 to 34MB), maintaining an overall 50% of traffic savings under this workload.
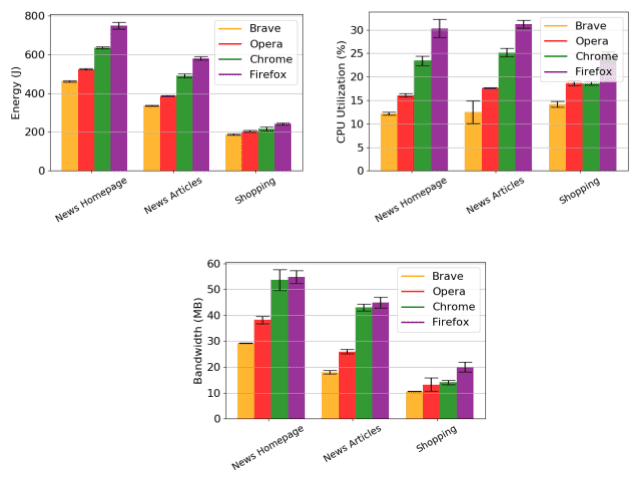
Browser Comparison
Next, we repeat the above analysis extending to a larger set of browsers which also include Firefox and Opera. For this test, we focus on the simple page load scenario and further reduce the duration to 30 seconds per website, so as to bound the test duration in presence of twice as many browsers. When comparing Chrome vs Brave, these results confirm what was observed above across the set of workloads we experimented with. Further, this analysis suggests that Opera is a closer performance competitor to Brave across all metrics. Firefox is instead at the other end of the spectrum, with performance falling behind all other browsers independently of the metric considered.
Page Load Speed
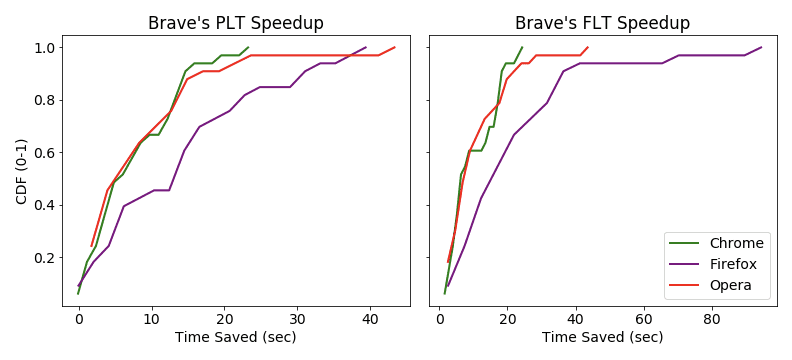
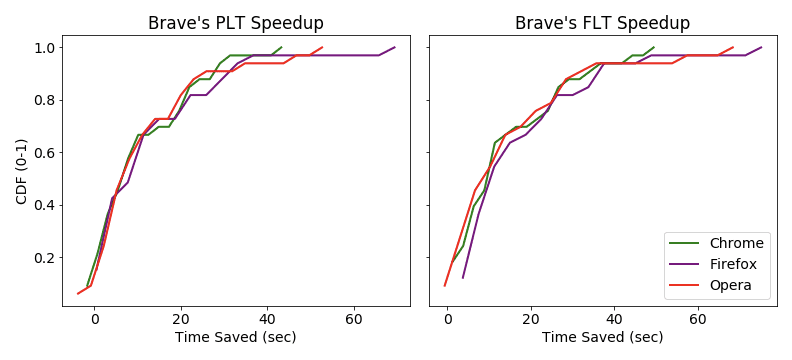
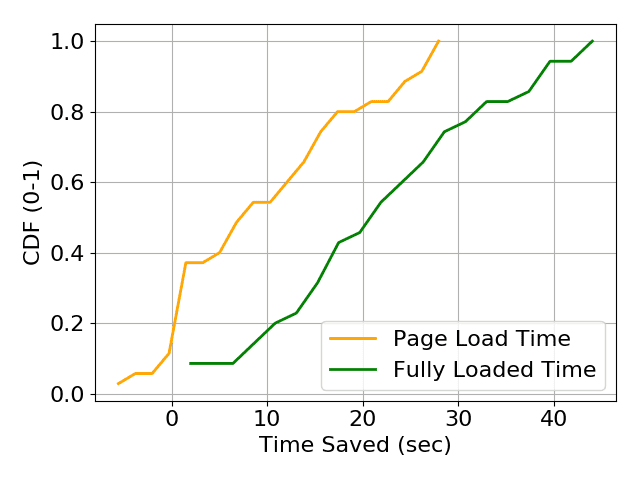
Last but not least, we investigate how quickly web pages are loaded in Android when comparing Brave against Chrome. For this analysis, we resort to Google lighthouse for metrics reporting. The figure below shows the CDF of the time saved (or wasted in case of negative numbers) by Brave differentiating between page load time and full page load time (median across three runs, when available) as introduced above.
Out of 35 websites tested, the onload event did not trigger for 7 websites when running Chrome, and are thus omitted. With respect for full-PLT, this only happened for one website loaded via Chrome. The figure shows that Brave is faster than Chrome for 24 out of 28 websites (85% of the websites) in terms of on-load, and for all 34 websites with respect to full-PLT. The time saved is also remarkable, with the majority of websites loading up to 10 seconds faster in Brave than in Chrome. This is the result of the bandwidth savings Brave manages to offer thanks to its privacy preserving features.
Synthetic Benchmarks
Because Brave is based on the same core web rendering engine and internals as Chrome and several other browsers, synthetic performance tests tend to give the same results when comparing Brave and Chrome. Brave’s advantage isn’t that it’s better at running complex JavaScript or doing advanced DOM manipulation — all Blink-based browsers score roughly the same at this, Brave included. Brave’s advantage is having to do far less work because it only loads the parts of pages that matter. Getting the same marks on synthetic benchmarks doesn’t reflect Brave’s real-word performance, but we compared it against all major browsers to make sure that nothing we do affects it negatively either.
We benchmarked all browsers against 4 popular synthetic benchmarks:
- Kraken 1.1 that measures the speed of several different test cases extracted from real-world applications and libraries. Created by Mozilla.
- Speedometer 2.0, focusing on a simple application implemented in a range of different popular JavaScript frameworks. Created by Apple.
- JetStream 2 combines together a variety of JavaScript and Web Assembly benchmarks, covering a variety of advanced workloads and programming techniques.
- BaseMark Web 3.0, primarily testing real-time web graphics and some of the most popular JavaScript frameworks.
Since the MacOS and Windows machines have different hardware, the results on each are not directly comparable, only the different browsers on the specific machine are. We use orange colour for MacOS tests and blue for Windows. The benchmarks themselves also provide somewhat noisy metrics - we highlight the error margin in gray in each measurement.
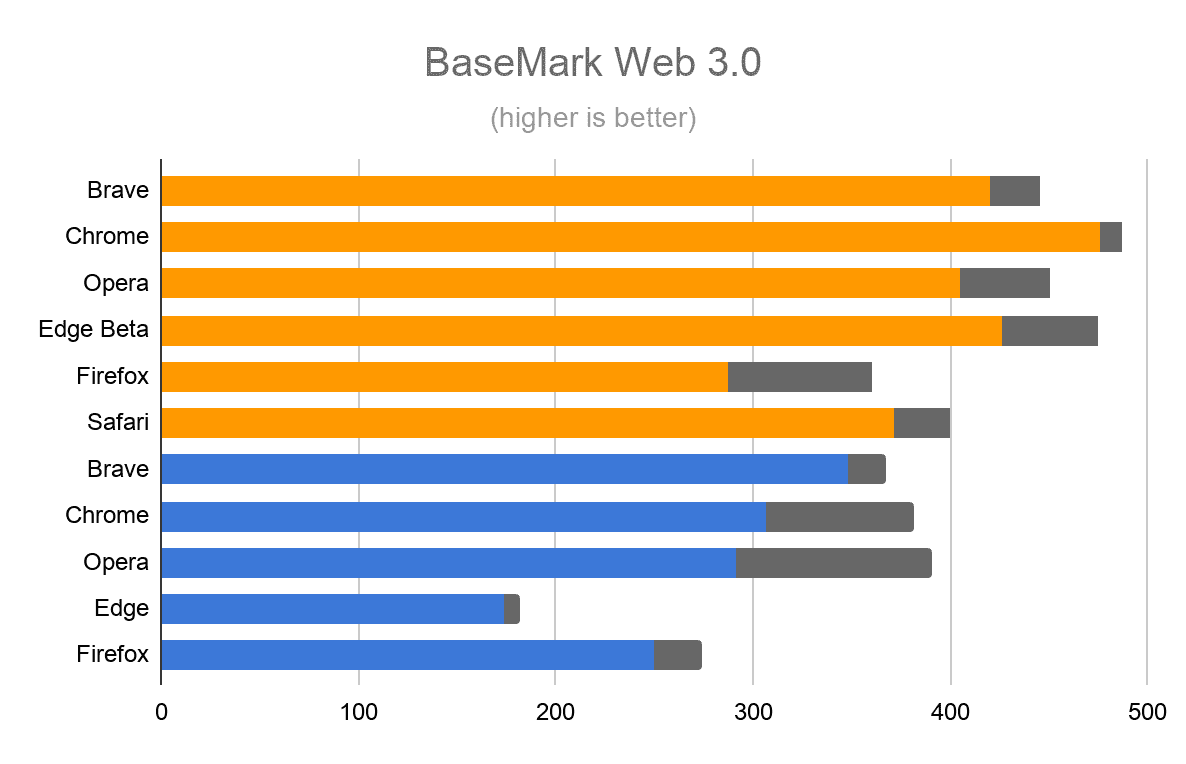
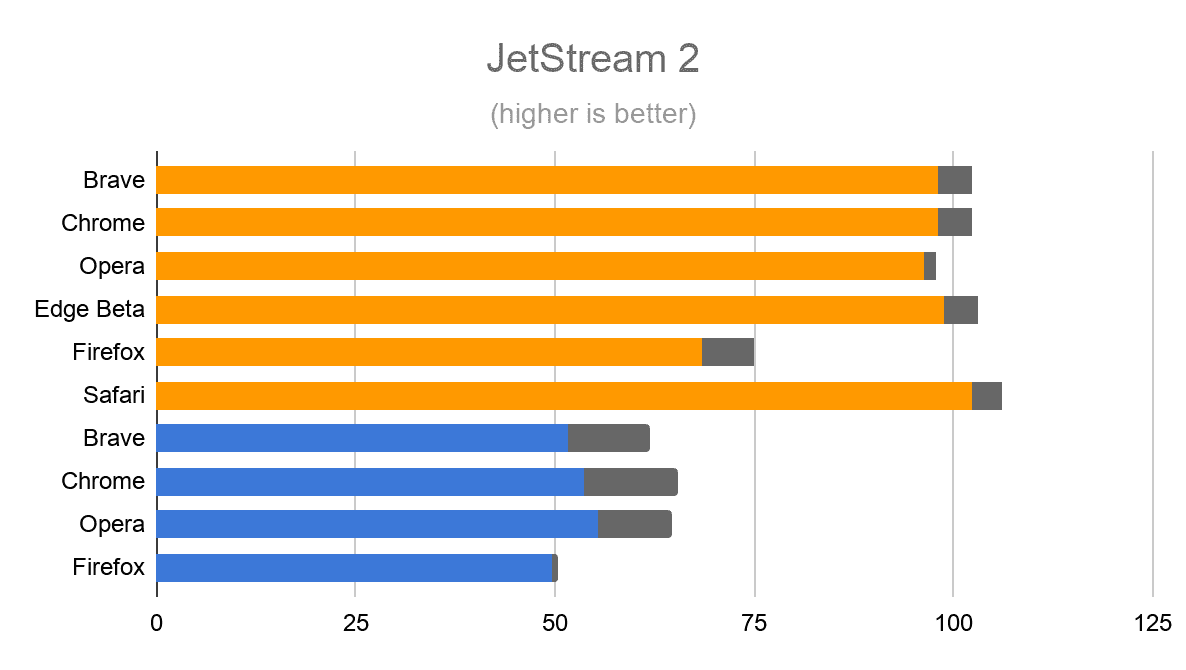
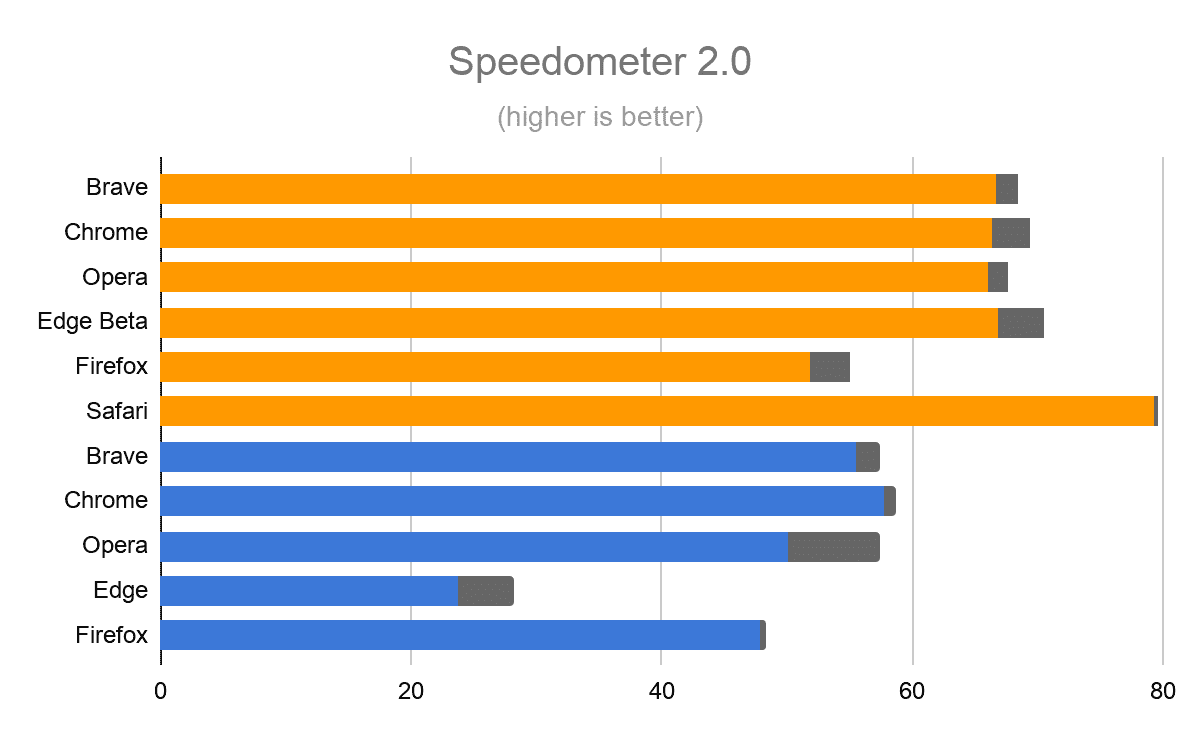
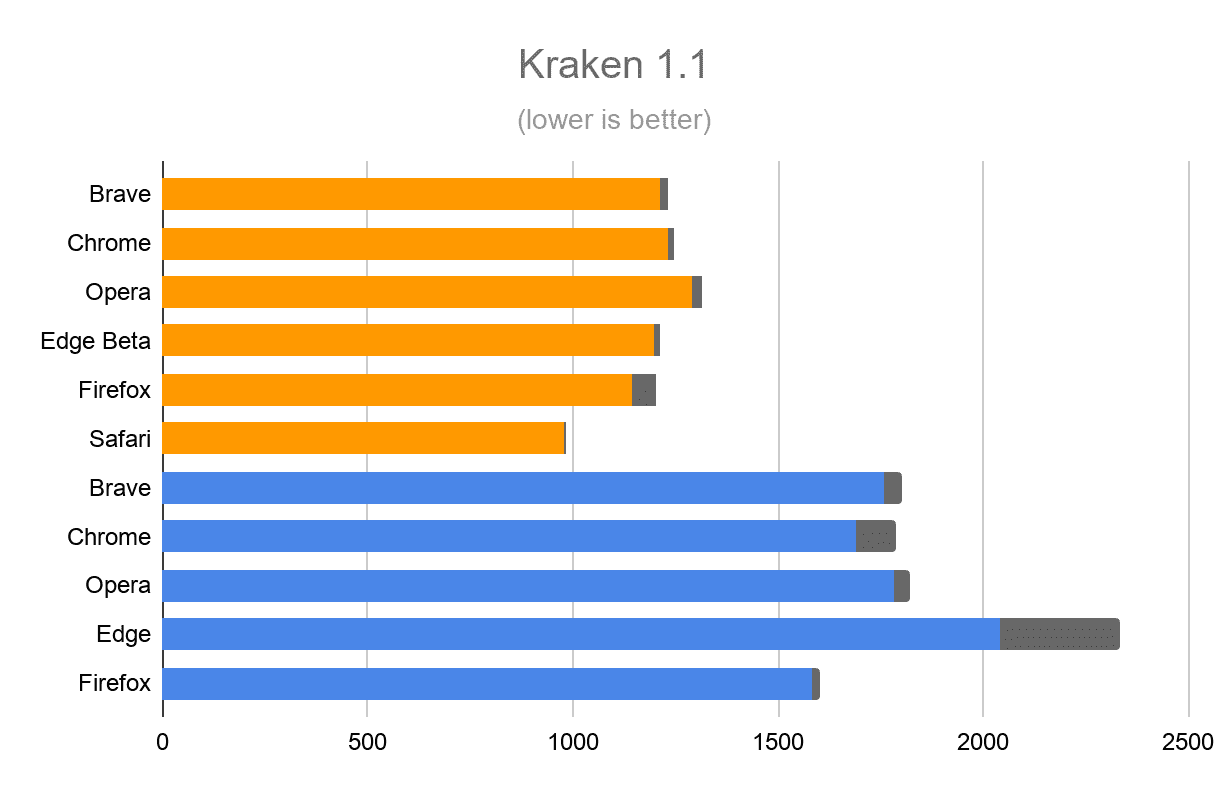
The benchmarks also differ in their robustness - the error margins across multiple runs on the same version of a browser, the same hardware and operating system suggest that a direct comparison of a single measurement should be considered with caution. This is especially visible in the case of BaseMark Web 3.0 benchmark. Note, however, that all Chromium-based browsers perform very similarly (i.e. within the error margin indicated in gray) on both MacOS and Windows. This is expected, since the underlying engine responsible for JavaScript execution and HTML rendering is the same.
Conclusions
For the 1.0 evaluation we put together a comprehensive testbed, comparing Brave against Chrome, Firefox and Opera on Windows, MacOS, and Android. We used the testbed to compare these browsers across memory use, page load speed, data and power use, as well as traditional synthetic benchmarks. Most of our automation along with realistic workloads have been published online for reuse in the future as the web keeps evolving.
This post highlights that Brave’s focus on performance delivers results where they matter, saving users’ resources across the tested operating systems (MacOS, Windows, and Android) when compared to all major browsers. Benefitting from a solid Chromium platform underneath — used by a growing band of browsers — Brave’s built-in privacy protection mechanisms save seconds on every single page load, while reducing memory use by hundreds of megabytes. Especially important for mobile users, Brave also realizes 30%-50% bandwidth and battery savings, making both the user’s data plan, and their battery, last longer.
These efficiency gains are not, however, a matter of vanity or competition. Brave’s mission is to remove the existing bloat accumulated on the web caused by years of irresponsible tracking and advertising practices, from which neither users nor publishers benefit. This approach allows us to keep the web open to everyone, including people who don’t have the newest and most powerful phone, or unlimited data connectivity. The robust and transparent benchmarking, which we have here presented, is another important step towards our journey to an open web.