Brave for Android continues to outperform other browsers in speed and performance, based on recent tests
This post is part of an ongoing series evaluating Brave’s performance. It describes work done by Kleomenis Katevas (Senior Machine Learning Researcher) and Artem Chaikin (Senior Mobile Security Engineer).
In late 2019, alongside the release of browser version 1.0, Brave ran a series of tests to measure Brave’s performance. These tests showed clear wins in page-load speed, data usage, battery consumption, and other metrics when compared to the default experience in other browsers, and especially against browsers with extension-based ad blockers.
Recently, Brave updated and re-ran these tests specifically for the Android operating system, with the goal of validating whether the Brave 1.0 performance benefits have held as the Brave browser has evolved. The short answer is that, yes, Brave for Android continues to be faster, use less battery and CPU, and consume less mobile data or Wi-Fi bandwidth. In particular, Brave uses, on average, 4% less battery and 9% less CPU; loads webpages 21% faster; and uses 14% less bandwidth among the tested Android browsers. We attribute these performance wins to Brave’s advanced privacy and security features, which block ads, trackers, fingerprinting, and bounce tracking by default. These protections both enhance user privacy and reduce unnecessary network requests and processing overhead, leading to faster load times and lower energy consumption during everyday browsing.
This post will give a full description of the testing environment, methodology, and performance results on Android devices. We plan to publish a similar set of results for desktop and iOS devices in the future.
Testing environment: hardware and software
The hardware used in our testing environment is a popular Android device: the Google Pixel 6a (2022), running Android 13 (build TQ3A.230605.010). It features an octa-core processor (2×2.80 GHz Cortex-X1, 2×2.25 GHz Cortex-A76, and 4×1.80 GHz Cortex-A55) and 6 GB of RAM.
The following browser versions, which were the latest available as of July 1, 2025, were used in our testing:
- Brave (v1.80.113)
- Chrome (v138.0.7204.46)
- DuckDuckGo (v5.240.0)
- Edge (v137.0.3296.92)
- Firefox (v140.0.3)
All tests were conducted on a dedicated 50Mpps internet connection in London, UK. The Android device was connected to an internal 5 GHz WiFi network (Wi-Fi 6, 802.11ax).
Metrics and points of comparison
Our performance evaluation focuses on the following attributes of browser performance:
- Battery discharge (mAh) – A critical factor for mobile devices, which rely heavily on battery power. High energy consumption is typically associated with poor user experience, leading to shorter usage time and increased anxiety about battery life.
- CPU utilization (%) – Reflects how intensively the browser engages the processor during activity. Excessive CPU usage can degrade performance, increase device temperature, and negatively affect user experience.
- Memory utilization (MB) – Measured using proportional set size (PSS) to evaluate how efficiently the browser manages RAM, particularly important for devices with limited memory resources.
- Page Loading Time (sec) – Assessed via
loadEventEnd, it represents the time from the initial request until the full page becomes interactive. - Bandwidth consumption (MB) – Captures the total data received (Rx) and sent (Tx) during browsing. These metrics indicate how efficiently the browser handles network transfers, which is especially important in data-sensitive or bandwidth-constrained environments.
Workload
For our real-world use case, we tested the 50 most popular websites (as ranked by Brave Search statistics), each paired with a randomly selected subpage—100 shuffled urls in total—while simulating user interaction with the loaded content. Each experiment was repeated 10 times, with a randomized order of the browsing app per run.
For the Android analysis, we first saved the app profiles after opening each browser, skipped the onboarding screens, chose the default settings, and waited 60 seconds to ensure that all components were up-to-date. The same profiles were used across all 10 test runs, with the actual workload of each experiment being:
- Restore the browser profile.
- Open the browser app and wait 60 seconds.
- For each URL:
- Open the URL and wait 30 seconds.
- Scroll down 3 times, with a 5-second wait between each scroll.
- Close the tab.
See the list of domains included in our tests.
Android benchmarking
To evaluate browser performance on Android, we used our open-source BLaDE infrastructure (v0.3) with a Google Pixel 6a. We implemented a battery-bypass setup, which involved removing the battery, isolating the internal controller, and wiring external power terminals. This hardware modification enables precise power measurements, offering higher accuracy than other, software-based methods.
For accessing page loading time metrics, we employed a proxy server (mitmproxy v8.1.1) and dynamically injected a JavaScript snippet that reported page loading-related metrics to a local Web server.
CPU utilization was monitored by sampling the device’s /proc/stat every 3 seconds. To measure memory overhead per URL we collected the proportional set size (PSS) of the associated browser processes using dumpsys meminfo before closing each tab.
In order to minimize measurement noise, we prepared the device using well-established best practices.
Resource usage
We began by analyzing resource usage—specifically energy, CPU, and memory consumption—per URL, across the five mobile web browsers. Figure 1 shows bar plots for each browser, where each bar represents the total power discharge (in mAh) required for the task. Error bars denote the 95% confidence interval across 10 runs, illustrating the consistency of power usage.

Among the tested browsers, Brave was the most energy-efficient, consuming 557.68 mAh in total—about 3.9% less on average than Chrome, Edge, and Firefox, and 23.7% less than DuckDuckGo. A similar trend appears when testing the CPU utilization (Figure 2), with Brave using 5.5% less CPU on average compared to Chrome, Edge, and Firefox, and 17.6% less than DuckDuckGo.

Note that the DuckDuckGo browser consistently showed significantly higher energy consumption across all tests. Upon investigation, we identified a resource management issue: when a tab is closed, the app fails to properly terminate the associated WebView. As a result, background processes continue running, leading to elevated energy usage and inflated performance metrics—particularly in terms of bandwidth received. This issue was especially evident on ebay.com, where live streaming content continued to be received and processed for several minutes after the tab was closed. We have submitted these findings to the DuckDuckGo development team for further investigation.
To evaluate memory usage across different browsers, we monitored the PSS of the relevant browser’s process. For DuckDuckGo, which relies on the operating system’s WebView, we also accounted for the WebView’s memory overhead. Figure 3 presents a cumulative distribution function (CDF) plot of the memory consumption of each browser.

Brave is 4.6% higher in total than Chrome, a difference largely explained by Brave’s built-in features—most notably its native ad and tracker blocker, which Chrome lacks. This small trade-off enables better privacy and speed without the need for external extensions. Brave is actively working on reducing memory usage in its native ad and tracker blocker which should reduce this difference significantly in the coming months. Importantly, Brave still uses, on average, 31.1% less memory than DuckDuckGo, 9.8% than Edge, and 40.1% than Firefox, underscoring its efficiency despite the added functionality.
Page load speed
The most noticeable difference for users when using a Web browser is how quickly it loads websites. As mentioned earlier, we leveraged mitmproxy at a local web server, to dynamically inject JavaScript into each loaded website, and measure the time until the loadEventEnd event. These measurements were collected on a per-URL basis, capturing variations across different websites. Figure 4 presents a cumulative distribution function (CDF) plot of these load times for each browser. Brave consistently outperforms the other browsers, with the fastest overall load time distribution, and over 80% of pages loading in less than 2.5 seconds.

Bandwidth consumed
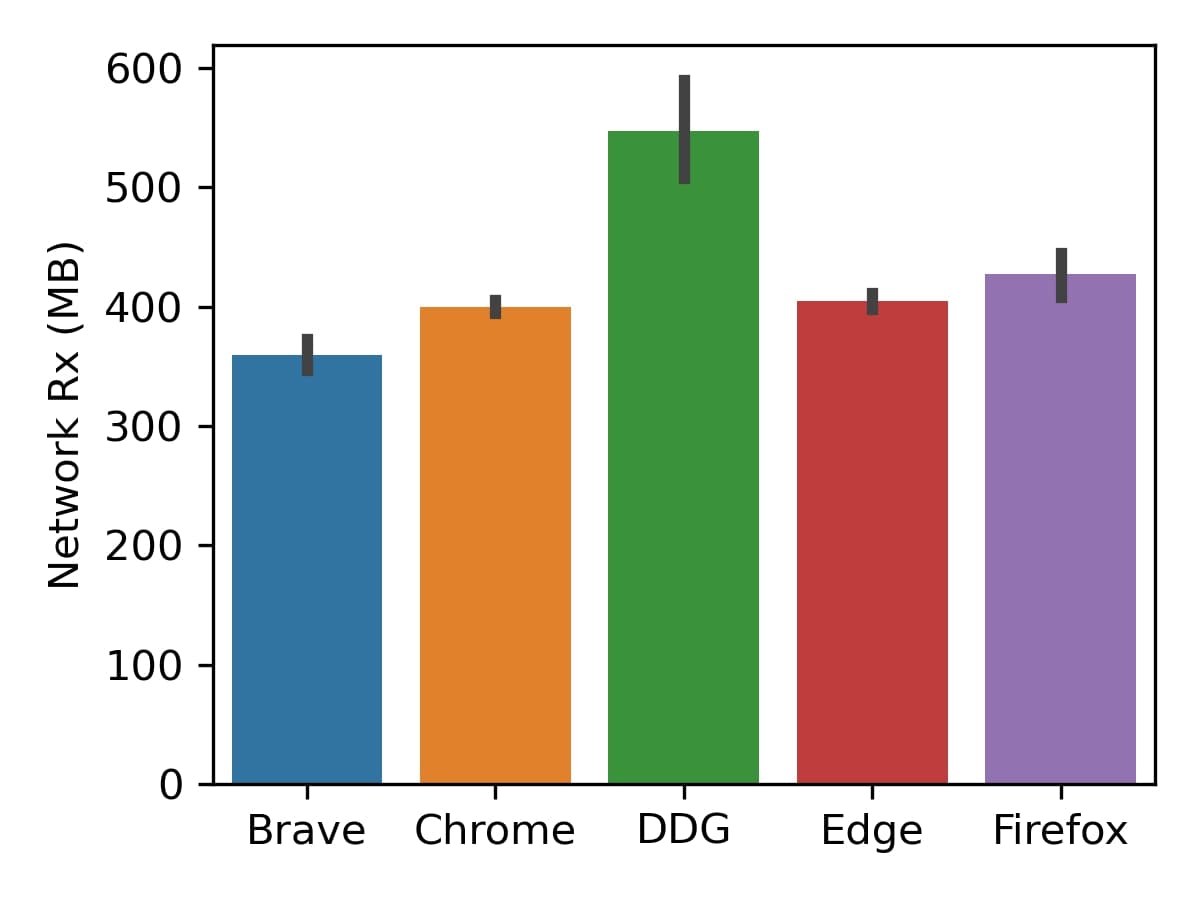
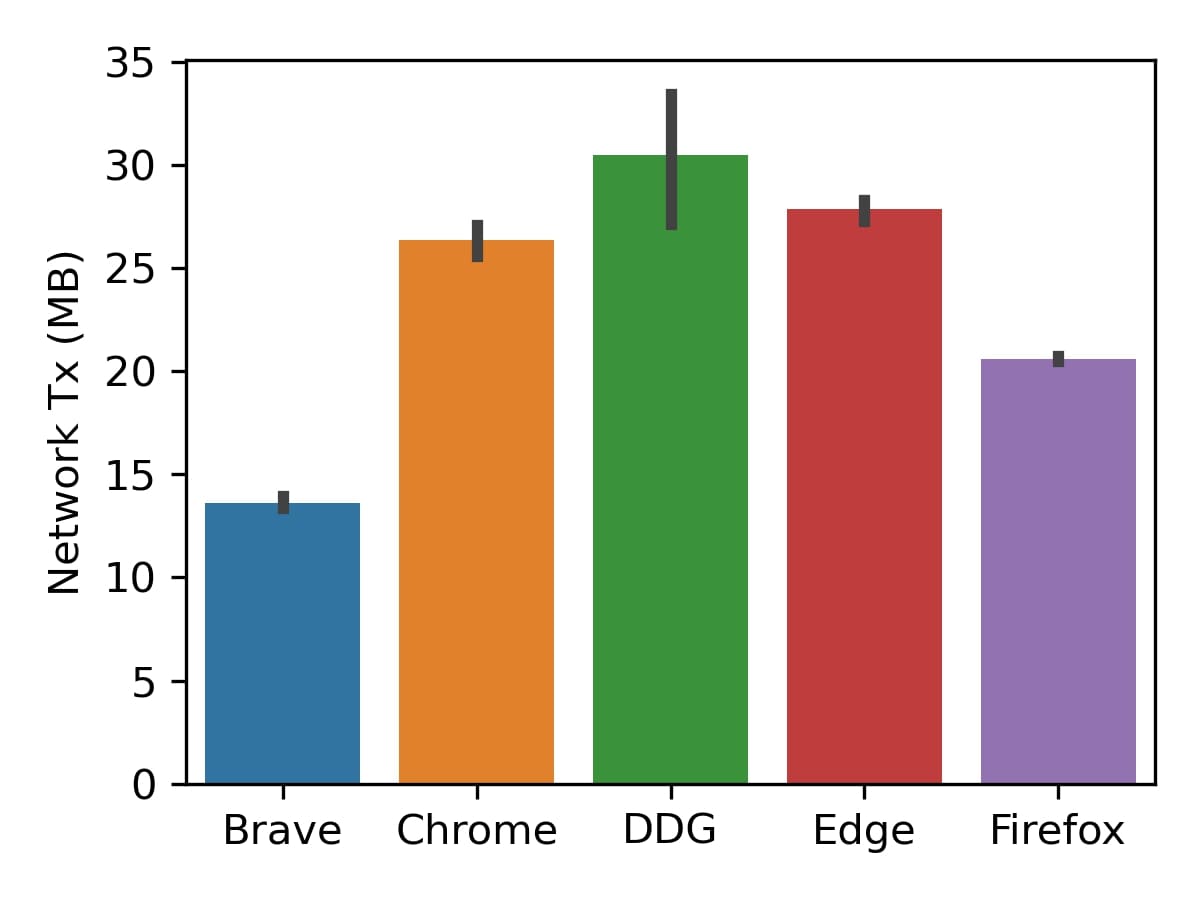
To evaluate bandwidth consumption, we analyzed two key metrics: network Rx, which captures the total amount of data received over the network (Figure 5a); and network Tx, which reflects the total amount of data transmitted (Figure 5b). Error bars in both figures denote the 95% confidence interval across 10 runs. We collected these measurements using adb shell dumpsys netstats, allowing us to accurately track per-app network usage.
Among the tested browsers, Brave demonstrated the most efficient network usage, receiving 359.6 MB and transmitting just 13.6 MB—up to 34% less inbound and 55% less outbound data than DuckDuckGo, and up to 16% less inbound and 51% less outbound than the rest of the competing browsers. These results highlight Brave’s clear advantage in minimizing both inbound and outbound data usage, by blocking unwanted requests.
Synthetic benchmarks
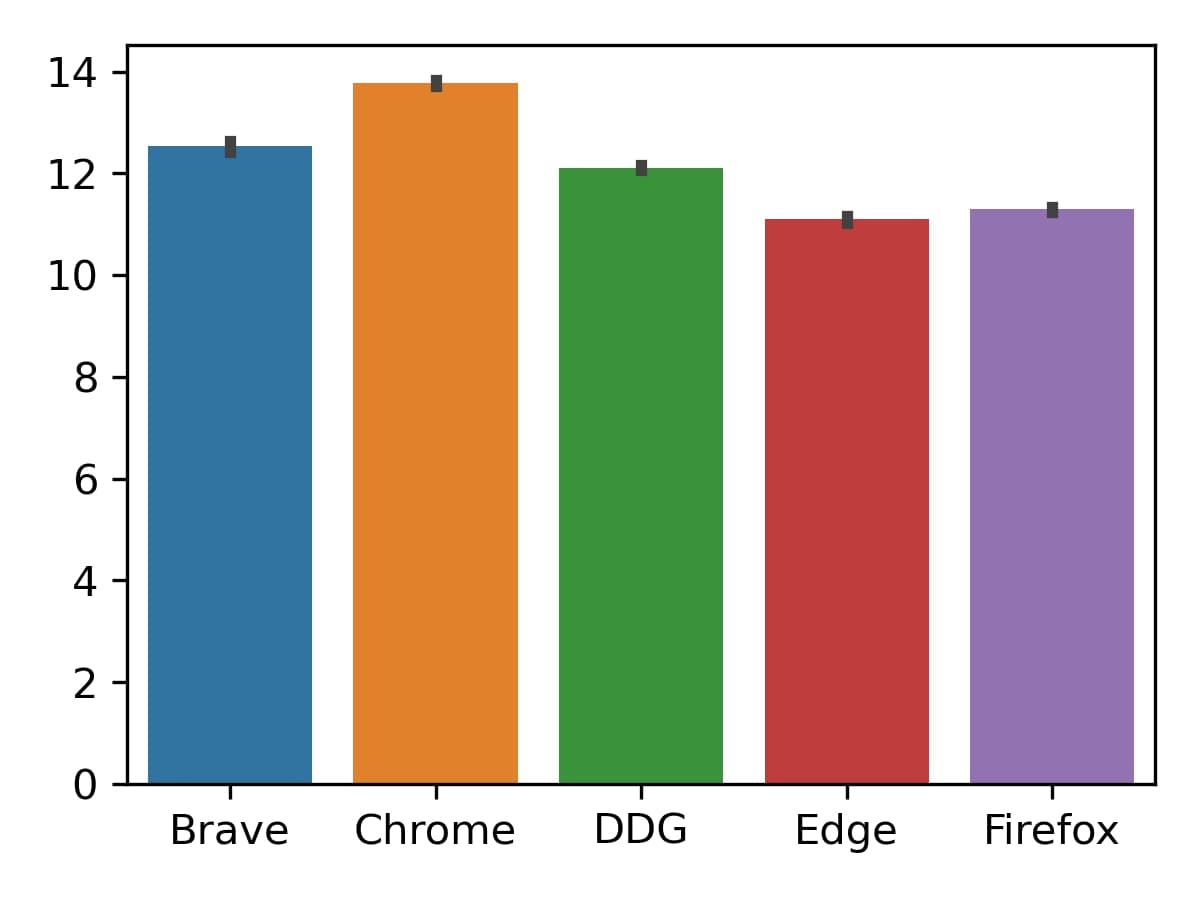
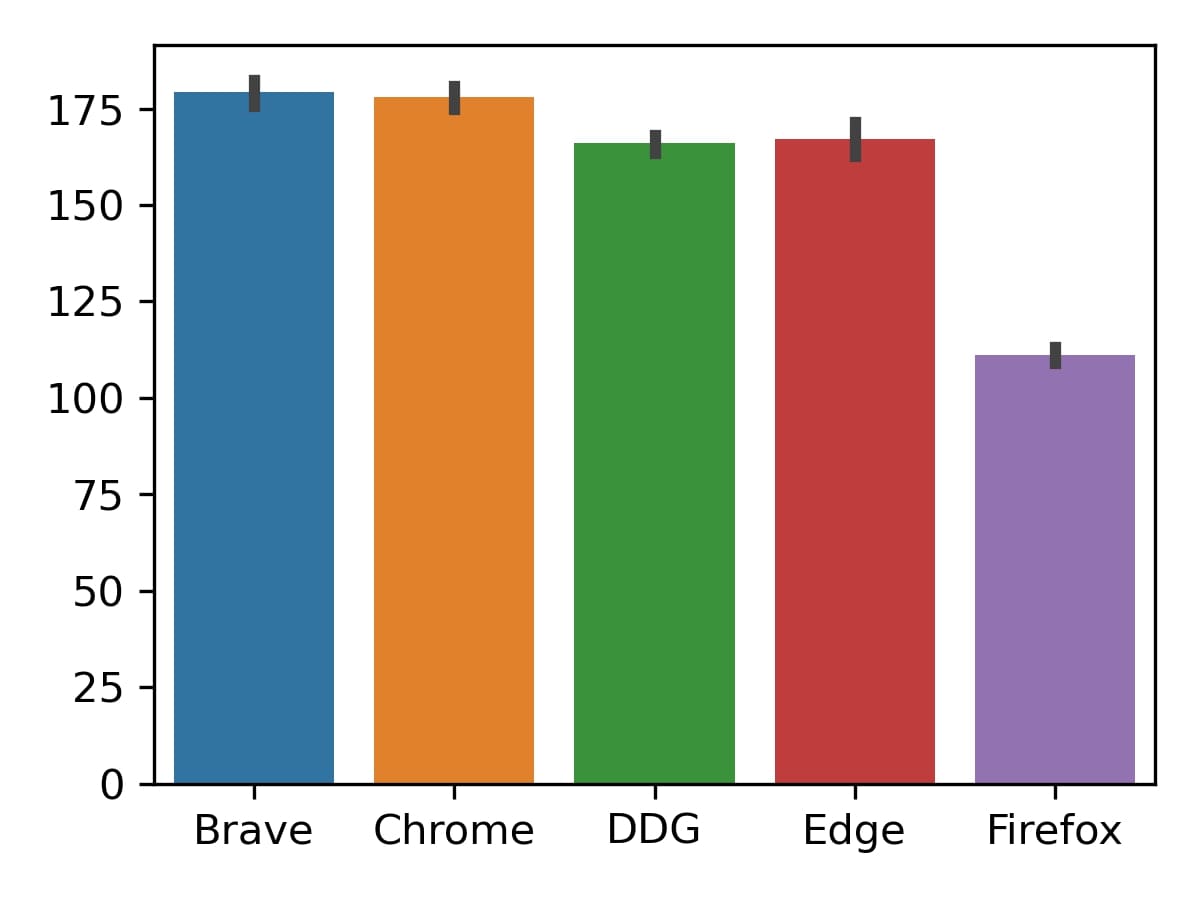
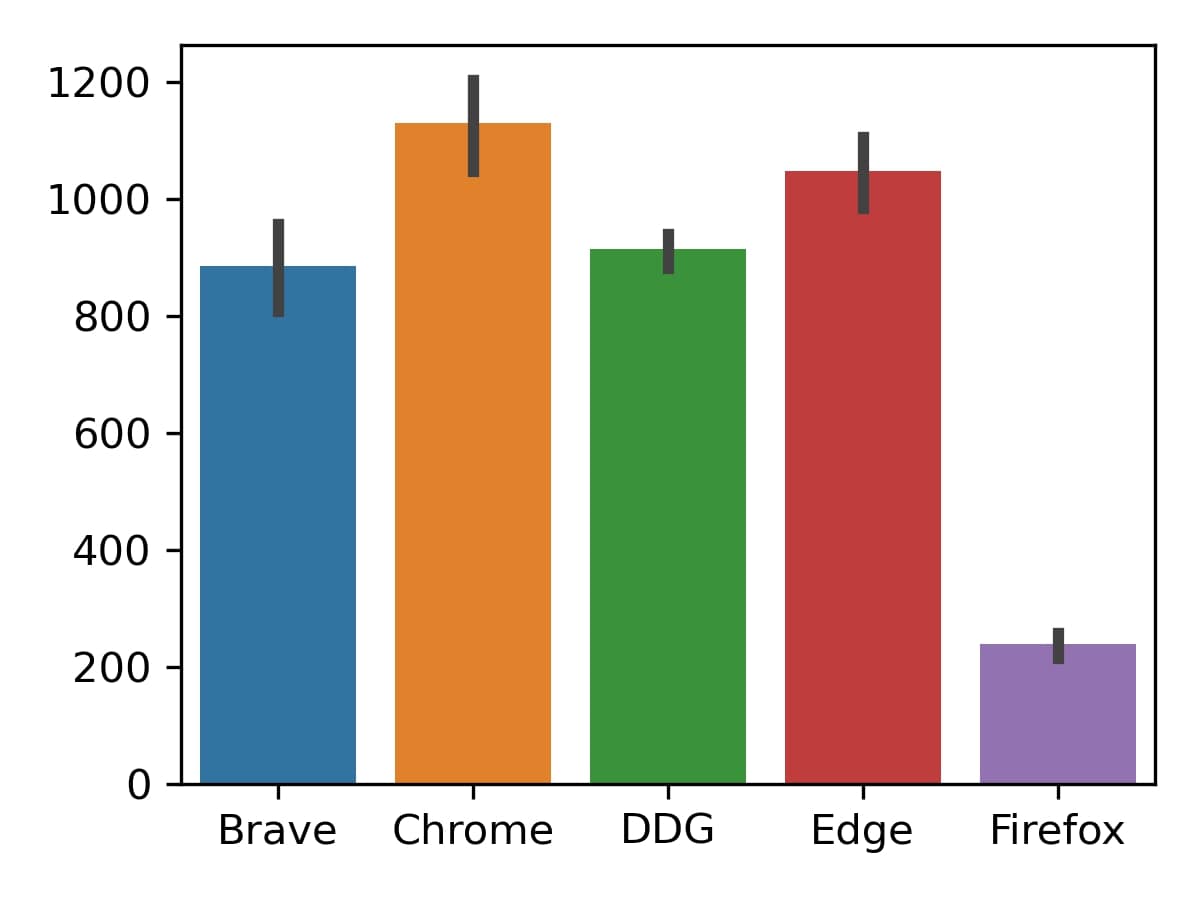
While synthetic benchmarks like Speedometer, JetStream, and MotionMark are commonly used to evaluate browser performance, they primarily focus on specific aspects of browser functionality:
-
Speedometer 3.1 measures how quickly a browser can execute JavaScript-based Web applications, simulating user interactions such as typing and updating UI elements.
-
JetStream 2.2 evaluates JavaScript execution speed and WebAssembly performance, assessing how well a browser handles computationally intensive tasks.
-
MotionMark 1.3.1 focuses on graphics performance, testing how efficiently a browser can render complex animations and visual effects at 60 frames per second.
Although these tests provide useful insights into raw engine performance, they omit crucial factors that affect real-world browsing—such as privacy protections, ad blocking, and network optimization. Additionally, because browsers like Brave, Chrome, and Edge share the Chromium engine, their benchmark scores tend to be similar, despite significant differences in real-world performance.
To provide a complete picture, we include results from these synthetic benchmarks (Figures 6a, 6b, and 6c), with each test executed 10 times on the latest browser versions. Error bars denote the 95% confidence interval across 10 runs. Under these controlled conditions, Brave consistently performs well, outperforming competitors in some instances (e.g. JetStream 2.2), while also delivering enhanced privacy and efficiency that improve the overall browsing experience.
Conclusion
As shown above, Brave continues to be the fastest, most resource efficient, and least network-heavy browser for Android devices. This is in part due to the extensive set of privacy and optimization features integrated natively into Brave. In the future we plan to run a similar set of tests for desktop and iOS mobile devices, and to periodically re-run these tests on all operating systems to ensure Brave remains the most performant major browser available.
For questions or comments about the results of this post, please contact the Brave Research team at blade-project@brave.com.


